
SHAREABLE FLIPBOOK DOWNLOADABLE PDF
1. EMERGING TRENDS IN REAL ESTATE
- According to the 2026 Emerging Trends in Real Estate Report by ULI-PwC, some of the industry’s key themes heading into next year include the foggy outlook for capital markets, niche asset classes becoming more essential, demographic shifts that will define demand, and the growing influence of artificial intelligence.
- For capital markets, liquidity and sales volume improved in 2025, but expectations for 2026 and beyond vary. Many CRE investors see lower interest rates, abundant debt, and pent-up equity demand as ingredients for short-term capital market expansion, but higher long-term rates and less foreign investment in the longer term.
- Data centers have emerged from a niche asset to an essential property type in 2026, with investors bullish on the growth of cloud computing, enterprise data management, and AI adoption.
- Survey respondents also project that senior housing and other residential subsectors, such as student and manufactured housing, will continue to expand as ageing US demographics create occupancy ripple effects across property types.
- Self‑storage has also evolved as more Americans compromise on size and location when deciding where to live, shifting it into a hybrid lifestyle and investment play.
- The report’s findings also suggest that the office market will remain bifurcated, as trophy buildings in major markets command record rents while lower‑quality properties struggle with high vacancies and depressed valuations.
2. OCTOBER EMPLOYMENT ACTIVITY
- The US private sector added 42,000 jobs in October 2025, while wages rose 4.5% year-over-year, according to the latest ADP National Employment Report.
- In the absence of monthly jobs data from the BLS, the ADP report provides the most current snapshot of national employment trends.
- The October increase marked the first time since July that private employers expanded payrolls. However, hiring remains well below the pace seen earlier this year. Service-providing industries added 33,000 positions, led by trade, transportation, and utilities (+47,000), offsetting losses in professional and business services (-15,000).
- Employers announced 153,074 job cuts in October, up 175% year-over-year and 183% month-over-month. The report notes that industries are recalibrating following the pandemic-era hiring boom, even as AI adoption rises, and consumer spending softens.
3. NATIONAL OFFICE PERFORMANCE
- According to Commercial Café’s National Office Report, the national office vacancy rate was 18.6% in September, 80 basis points (bps) lower than one year before.
- The average listing rate in September was $32.79 per square foot, 0.3% above the September 2024 level. Atlanta ($36.32), Portland ($28.85), and Miami ($56.45) registered the highest listing rates, while Washington, D.C. (+230 bps), Nashville (+220 bps), and the Twin Cities (+190 bps) experienced the largest year-over-year rent increases.
- Manhattan topped the list for year-to-date sales, reaching $5.5 billion through September. The Bay Area followed with $4.3 billion in sales, while Washington D.C. ranked third with $3.2 billion in sales.
- Miami and Manhattan tied for the lowest office vacancy rates in September, each averaging 12.8%.
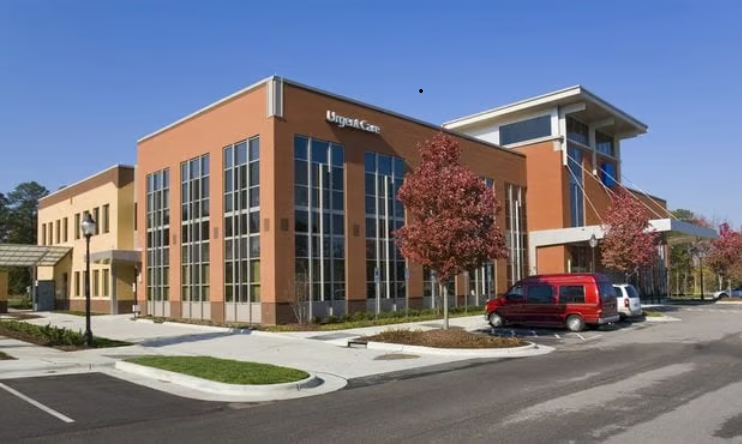
4. MEDICAL OFFICE BUILDINGS STAND OUT

- An October deep dive by Globe Street suggests that Medical Office Loans continue to stand out for their stability and growth.
- According to Trepp data, CMBS delinquencies in the sector stand at just 6.15% through September, compared to the 11.31% average for conventional office loans.
- The relatively strong performance points to solid fundamentals for the sector. Data from Transwestern shows that medical-office vacancies fell by 20 basis points year-over-year through Q2, compared to a 40-basis-point increase for the traditional office segment.
- Demographic shifts and workforce trends are fueling the relative success of the medical office. According to the Bureau of Labor Statistics, through August, health care-related employment is up from one year prior, while jobs in conventional office-based sectors, such as professional and business services, have declined.
5. CRE TRANSACTIONS STUCK AT PRE-COVID PACE
- According to a recent Moody’s analysis, commercial real estate dealmaking remains relatively sluggish despite a strong start to the fall. Although the dollar volume of CRE transactions is up 5% year-over-year through September, transaction volume remains stuck at pre-COVID levels.
- Transaction data suggest that a flight to quality might be taking shape. The average CRE transaction in September was $12.7 million, up from $11.2 million one year ago.
- Further, zooming in on the 50 largest transactions of the third quarter, all exceeded $73 million, while 29 of those 50 exceeded $100 million, which was a 35% jump compared to the third quarter of 2024.
6. LOGISTICS ACTIVITY
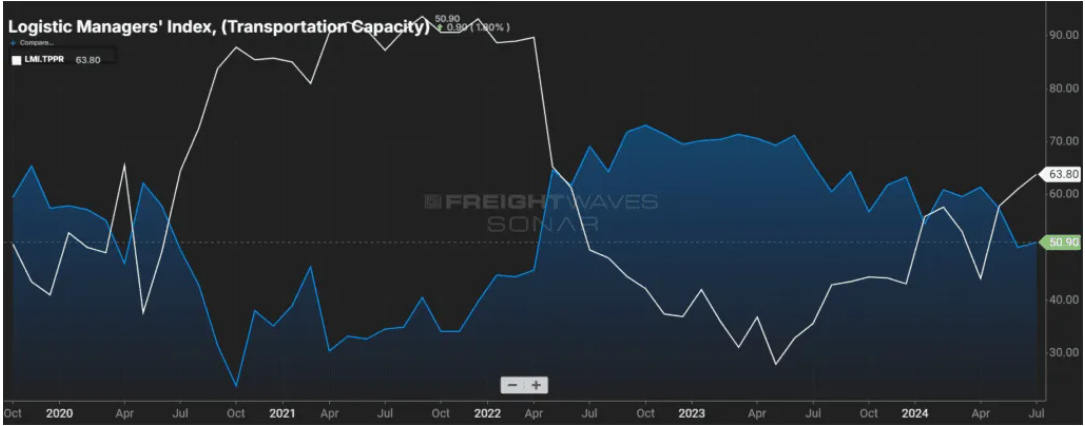
- Logistics sector growth was unchanged in October compared to the month before, according to the latest Logistics Managers’ Index. At 57.4, the current reading indicates a low but steady rate of industry expansion—a reading above 50 indicates that logistics activity is expanding nationwide.
- Expanding transportation activity is driving growth in the sector, offsetting some of the downward pressure from declining inventory and weaker warehousing demand.
- Transportation utilization increased during October, rising 7.3 index points to 57.3. Transportation prices rose 7.5 points to 61.7. Inventory levels contracted slightly on the month (49.5) while warehousing utilization slowed (56.5).
- Taken together, logistics trends suggest that inventories are dropping as holiday sales kick off, easing warehousing demand while increasing transportation utilization.
7. INSURANCE COVERAGE AMONG RENTERS

- A recent analysis by Chandan Economics shows that renters are nearly three times as likely to be uninsured as homeowners (11.7% versus 4.4%) and are more reliant on public plans.
- Just under half of renters (48.8%) have private insurance, while nearly one in three (29%) rely exclusively on public coverage.
- Within the rental market, coverage outcomes vary meaningfully by property type. Single-family renters show the weakest coverage profile—49.2% private and the highest uninsured rate (12.8%). Roughly 16% of single-family renters with private insurance receive a subsidy, compared to an average of 18% among all renters.
- Multifamily renters are the most securely insured, with 51.2% covered by private insurance, while just 9.8% are uninsured.
- With ACA subsidies in legislative play, potential disruption would have a disproportionate impact on renters, particularly those in small buildings and single-family homes, potentially raising delinquency risk and softening leasing velocity.
8. 2026 APARTMENT RENT FORECAST
- According to a recent RealPage analysis, average market-rate effective rents are projected to climb to 2.3% nationally over the next year, a rebound from a 0.7% decline in the year ending in October 2025.
- The analysis points to a broad-based increase in apartment rents, with 11 of the nation’s 50 largest markets expected to see rent gains of 3% or higher.
- Miami (+3.8%), Seattle (+3.7%), Fort Lauderdale (+3.5%), and Los Angeles (+3.2%) topped the list of metros expected to lead the resurgence in growth.
- Several midwestern and coastal cities, including Cincinnati, Columbus, and San Francisco, are also poised for upticks in growth. Each of these three markets is expected to grow by 3.1% annually over the next year.
9. SMALL BUSINESS OPTIMISM
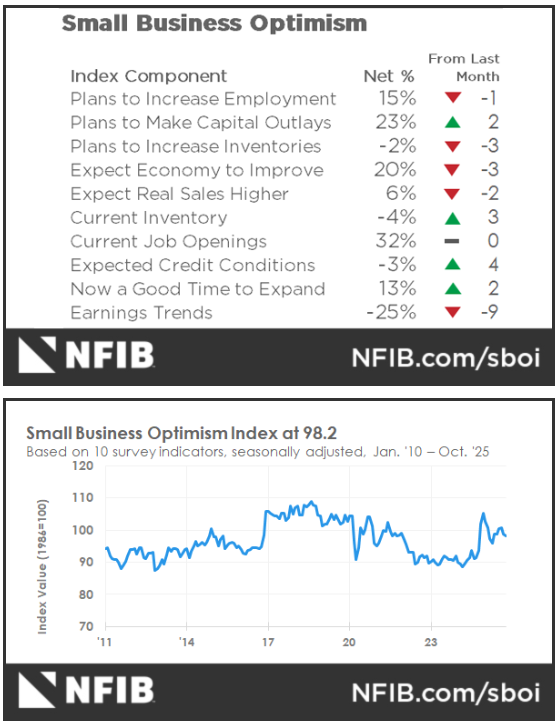
- According to the National Federation for Independent Businesses, small business optimism slipped in October but remains well above its 52-year average.
- Sales and profit expectations fell, with a net 13% of business owners reporting lower sales over the past three months, while a net 25% report negative profit trends.
- Labor shortages remain the top concern affecting small businesses. 32% of owners report having unfilled job openings, while 27% cite labor quality as their most pressing problem —the highest share since 2021.
- Price pressures moderated from the month prior but continue to affect over one in five small businesses. 21% of firms raised their prices in October, with 30% planning to increase them in the coming months.
10. CONSUMER SENTIMENT
- According to the University of Michigan’s preliminary November Consumer Sentiment Index, the index fell 6% from 53.6 in October to 50.3 in the latest reading.
- The decline in sentiment was led by a 17% drop in current personal finances and an 11% decline in year-ahead expectations for business conditions.
- The analysis notes that the federal government shutdown likely contributed to the decline in sentiment, and preliminary findings were made before the shutdown ended.
- Sentiment weakened across most age and income groups, although households with large stock holdings experienced a bump in confidence.
- Short-term inflation expectations edged higher from 4.6% in October to 4.7% while long-run expectations eased from 3.9% last month to 3.6%
SUMMARY OF SOURCES
1. OCTOBER EMPLOYMENT UPDATE
- In lieu of the usual monthly employment report from the Bureau of Labor Statistics, recent private jobs data illustrate persisting labor market weakness during September.
- The ADP National Employment report, which tracks private payrolls, showed a decline of -32,000 jobs during September and follows a reported decline of 3,000 jobs in August. It was the first back-to-back monthly decline in private sector jobs since 2020.
- Elsewhere, online hiring platforms Indeed and LinkedIn reported job posting declines of 9% and 12%, respectively. Meanwhile, government job cuts continue to have an adverse effect on employment growth.
2. FOMC MEETING MINUTES
- Minutes from the September 2025 FOMC meeting reveal that policymakers continued to express a range of concerns despite a mostly unanimous decision to cut the Federal Funds rate by 25 basis points.
- The minutes emphasize recent employment reports indicating that the labor market was softening more than previously thought, particularly due to significant revisions in Spring and early summer employment totals.
- The growing warning signals from monthly employment data convinced most officials on the committee that the balance of risks (labor market vs. inflation) had shifted towards the labor market.
- Nonetheless, inflation worries continue to linger amongst policymakers. A majority of participants still see upside risks to inflation, in part due to recent tariff increases.
- The minutes also highlight divisions among committee members: some voted in favor of the cut but expressed concern that easing could allow inflation expectations to rise. In contrast, others sought a larger, 50-basis-point cut.
3. FED BEIGE BOOK
- US economic growth continued to stall over the past six weeks as labor demand remained muted and input costs rose, according to the Federal Reserve’s October 15th Beige Book update.
- Beige Book responses showed that economic activity nationally has changed little over this period. Three of the twelve Federal Reserve districts reported slight to modest growth, five reported no change, while four experienced a slight decline in activity.
- The latest update reflects a deterioration from the latest Beige Book in August, when one-third of all districts were still reporting modest economic growth.
- Employment conditions remain soft while firms report that prices are rising faster than profits.
- Real estate market conditions were mixed, with the Chicago Fed region reporting an uptick in construction and real estate activity, but most other districts reporting mostly flat activity compared to the previous six-week period.
4. SMALL BUSINESS OPTIMISM

- US small business optimism fell for the first time in three months during September, according to the National Federation of Independent Business.
- Supply chain disruptions and inflation emerged as the key factors reducing optimism among owners during the month.
- 64% of small business owners reported that supply chains were impacting their business to some degree. Meanwhile 14% of small business owners reported that inflation was their single most important problem.
- Earnings stood out as a positive aspect of the report, with respondents reporting their highest earnings since December 2021.
5. CONSUMER SENTIMENT

- According to preliminary estimates from the University of Michigan that were released on October 10th, US consumer sentiment was mostly unchanged from September.
- The index registered a reading of 55.0, a slight dip from September but close to historical lows. A reading above 50 indicates that more consumers view conditions as good than poor.
- The current conditions index modestly improved from September, climbing from an index level of 60.4 in September to 61.0.
- Future expectations fell in October, hovering just above neutral at 51.2. Consumers report declining optimism about the future of their personal finances and buying conditions for durable goods. Inflation expectations fell slightly.
- The report showed little evidence that the ongoing government shutdown is having any material impact on sentiment. However, given that results are preliminary, any potential impact may not be reflected until later in the month.
6. HOMEBUILDER SENTIMENT
- According to the latest NAHB/Wells Fargo Housing Market Index (HMI), builder sentiment was unchanged in September, matching both the August and June 2025 readings for the lowest level since December 2021.
- The September index reading of 32 was below market expectations of 33 and highlights how the housing market continues to perform weaker than expected. A number under 50 indicates that more builders view sales conditions as poor than good.
- Current sales conditions remained steady at a reading of 53, while prospective buyer traffic fell slightly from August to 21. Sales expectations for the next six months rose two points to 45.
- 39% of builders reported cutting prices in September, up from 37% in August, marking the largest share during the post-pandemic period.
7. LOGISTICS ACTIVITY
- Logistics activity fell from August to an index reading of 59.3 in September (a reading above 50 indicated expanding logistics activity), according to the Logistics Managers’ Index (LMI)
- The reading suggests that while logistics activity continues to expand, its growth has slowed significantly. It was the lowest LMI reading in six months.
- Transportation utilization dropped sharply to a neutral reading of 50, a notably weak reading during a typically busy freight season. The index tracking transportation prices slipped below transportation capacity as upstream companies reported weaker price expansion compared to downstream ones.
- Warehousing capacity and utilization each accelerated in September; however, warehousing prices experienced one of the steepest declines of all the individual metrics during the month, falling to a reading of 66.
- Inventory levels expanded (55.2) but at a slower pace compared to August. Inventory costs remained elevated (75.5).
8. FORECLOSURE ACTIVITY
- According to ATTOM’s Q3 2025 Foreclosure Market Report, both foreclosure starts and bank repossessions have seen significant year-over-year upticks. Overall filings were up 17% year-over-year in Q3 to a total of 101,513.
- There were 72,317 foreclosure starts during the third quarter, up 16% from one year ago. The highest number of starts were in Texas, Florida, California, Illinois, and New York.
- 11,723 properties were repossessed during the third quarter, up by a massive 33% year-over-year. Texas, California, Florida, Pennsylvania, and New York registered the highest number of bank repossessions.
- Filings are down 0.3% in September from August, suggesting that foreclosure activity may have peaked despite the annual deterioration.
- The average time to foreclosure is 608 days, down significantly (-25%) from where it was one year ago.
9. SELF-STORAGE RENTS
- After a sustained slump, self-storage rents rose in September, rising 0.3% month-over-month and 0.9% year-over-year, according to data from Yardi Matrix.
- Self-storage REITs are driving the gains. Same-store rents at REIT properties are up 2.6% year-over-year through September, while non-REIT operators saw rents climb just 0.1%
- The average rent stands at 16.80% per square foot, with both climate-controlled and non-climate-controlled units experiencing monthly gains.
- Midwest markets are leading performance on a metro level, led by Detroit (3.6%), Chicago (3.0%), and Minneapolis (2.9%), which are experiencing tight supply and strong multifamily fundamentals.
- Nationwide, 2.6% of the self-storage market is under construction, a slight downtick from August. Sarasota-Cape Coral (FL), Tampa (FL), and Phoenix (AZ) are the most active metros for new supply. Projects under construction represent over 6% of the inventory in these metros.
10. RETAIL TRENDS

- According to the private consumer and market research firm Circana, US retail sales were mostly flat during the five weeks ending on October 5th.
- Circana reports declines across several retail segments from one year ago, including discretionary general merchandise (-3.0%) and non-edible consumer packaged goods (-1.0%).
- All retail dollar-sales gains for the month came from food and beverage, which increased by 1%, but unit sales still fell across all retail segments.
- Circana researchers speak of an “invisible inflation”, where on the surface, retail sales have not realized the impact of inflation, but, in reality, consumers are cutting back on the volume of purchases while still spending the same overall amount.
SUMMARY OF SOURCES
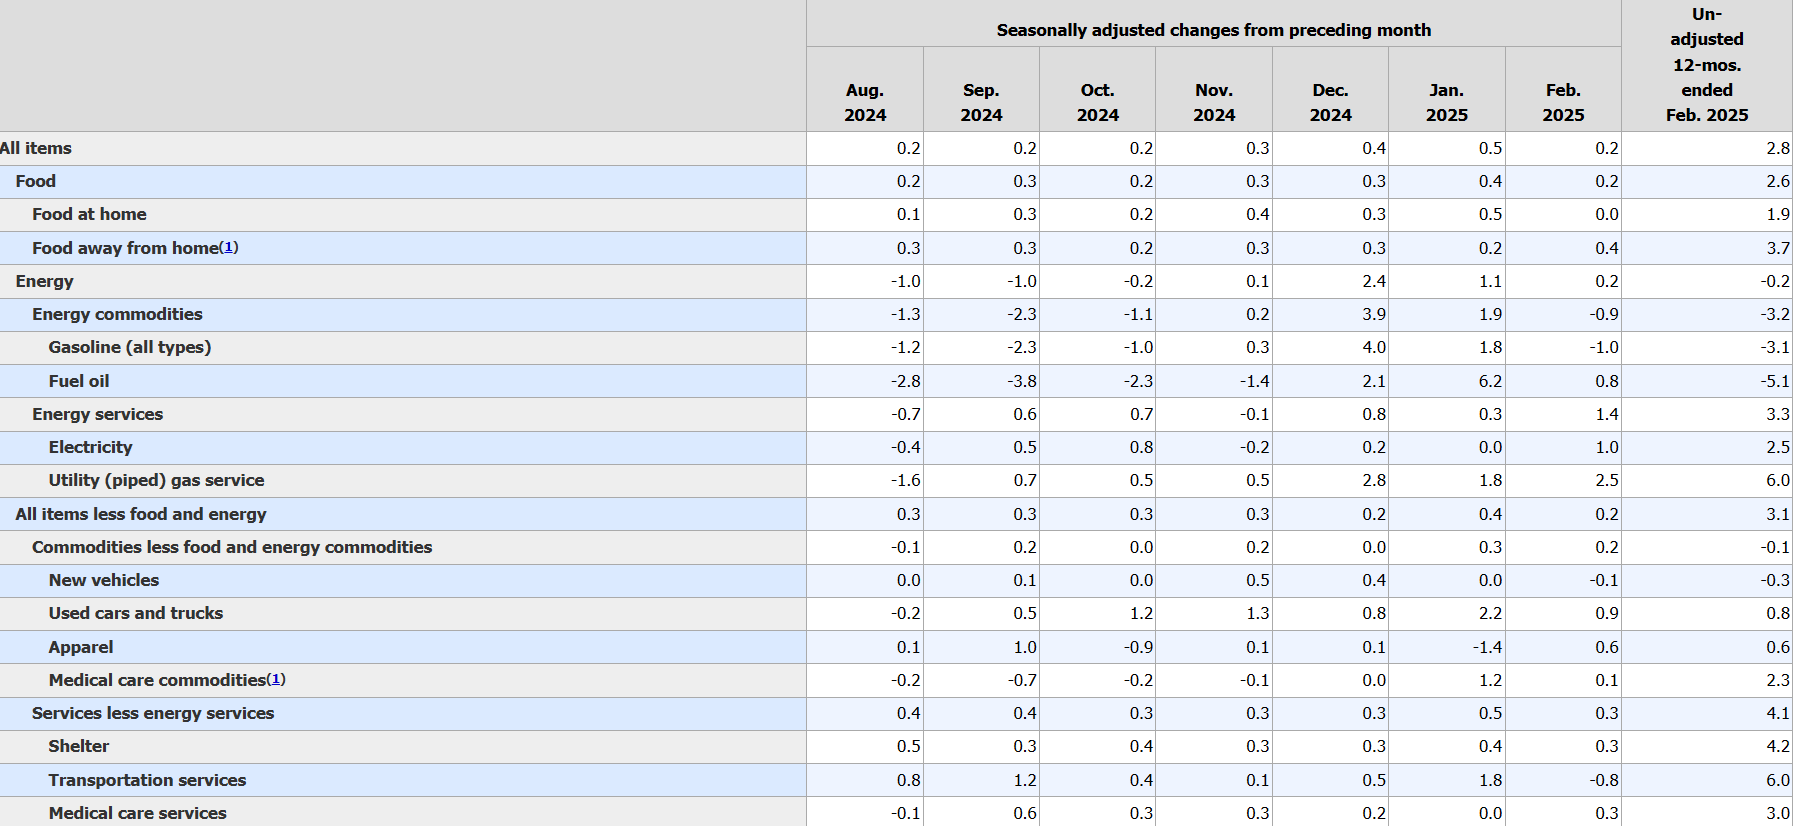
1. CPI INFLATION
- The Consumer Price Index (CPI) rose 0.2% month-over-month and 2.7% year-over-year in July. It marked the third consecutive month that prices accelerated on an annual basis, following three consecutive decreases to begin the year.
- Price pressures rose for items such as used cars and trucks, transportation services, and new vehicles, but fell for gasoline, fuel oil, and shelter. Food prices were relatively unchanged.
- Core-CPI prices, which strip out food and energy and more closely resemble what the Fed considers for monetary policy decisions, were even higher, clocking in at 0.3% month-over-month and 3.1% year-over-year.
- Reemerging core-CPI price pressures, which saw their sharpest rise in six months, add to the notion that tariffs and US trade actions made during the spring are beginning to show their effects on consumer prices.
- Despite the uptick, inflation came in slower than many feared, causing futures markets to raise the probability of a September rate cut from 85.9% one day before CPI was released to 94.2% following the report.
2. FOMC’S JULY INTEREST RATE DECISION

- The FOMC held the federal funds rate unchanged at its July policy meeting, a widely expected decision despite some signs of division about the ideal timing of a potential cut.
- Fed Chair Jerome Powell expressed the majority view on the committee that inflation remained modestly above target, and that while job growth has slowed compared to one year ago, so has labor supply— leaving the labor market relatively balanced, which is reflected in the relatively low headline unemployment numbers.
- Nonetheless, Powell’s remarks came days before a lackluster US jobs report that showed only 75,000 new payrolls were added in July and massive downward revisions for May and June.
- Many officials on the committee continue to note the uncertainty around tariffs and their potentially inflationary effects as a reason to leave rates moderately restrictive. However, while CPI data confirms that these pressures exist, emerging risks to the labor market have significantly increased the likelihood that officials will move forward with a September rate cut.
3. JULY JOBS REPORT
- The US added just 73,000 jobs in July, while May and June saw a combined revision of -258,000, the most significant two-month downward revision since the 2020 onset of the pandemic.
- After the revisions, May’s job growth was revised down to +19,000 from the original +144,000, while June’s payrolls were revised to +14,000 from an initially estimated +147,000.
- Employment trended upward in health care and social assistance, while federal government payrolls continued to decline. The unemployment rate ticked up to 4.2% while labor force participation was unchanged.
- Hiring has dropped across most age groups in recent months, but job postings for entry-level positions are especially weak. July saw the largest increase in the unemployment level among new entrants on record (+275,000) and rose to its highest level since January 2015.
4. THE GEOGRAPHY OF MULTIFAMILY GROWTH
- A recent briefing from Chandan Economics shows that since 2013, apartment household growth in semi-urban communities has outpaced that in both urban and suburban zip codes.
- Between 2013 and 2023, the number of semi-urban multifamily households rose by 25.5% compared to 23.7% in central city districts. Suburban multifamily households grew by a more modest 15.0%.
- While suburban apartment household growth trailed other geographies, it still outpaced total US household growth over the same period, which was just 13.5%.
- Semi-urban multifamily has emerged as one of the sector’s primary growth engines, with room for new construction and a cost structure that remains more favorable than dense downtown areas.
5. GDP
- Real US GDP rose by a seasonally adjusted annualized rate (SAAR) of 3.0% in the second quarter of 2025, following a 0.5% decline during the first quarter.
- Second quarter growth was primarily driven by a decrease in imports and an increase in consumer spending, which was partly offset by declines in exports and investment.
- Though growth came in higher than the first quarter, imports fell by a sharp SAAR of 30.5%, led by a decline in goods imports such as medicinal, dental, and pharmaceutical goods.
- Further, a significant part of the increase in consumer spending was expenditures on non-discretionary services such as health care services. In contrast, an alternative final sales measure that sums consumer spending and gross fixed investment increased by 1.2% compared to 1.9% in the first quarter.
6. LOGISTICS ACTIVITY
- Logistics activity dropped in July, indicating a broader slowdown in the sector as the effects of a new trade normal begin to settle in.
- A deceleration in inventory cost growth primarily drove the decline, as inventory levels expanded at a slower rate than in the spring, leading to a shift in warehousing capacity back into expansion.
- According to the researchers for the Logistics Managers’ Index, each of these shifts was driven by changes in activity by upstream firms or smaller retailers (less than 1,000 employees)
- Downstream and larger firms are reporting falling inventories, increased capacity, and lower price expansion.
- Transportation utilization rose in July while transport capacity and prices remained fairly consistent as freight activity gradually recovers.
7. INDUSTRIAL SUPPLY CLOSE TO PRE-2020 LEVELS

- According to a recent analysis by Commercial Café, the volume of industrial space being built is nearly equal to pre-pandemic levels, though with a different composition.
- 341.8 million square feet of industrial space is currently under construction nationally, while 146.6 million square feet has been completed so far this year.
- E-commerce and omnichannel retail continue to be the primary force driving post-pandemic industrial development, but over-development has pushed up the national vacancy rate.
- The average industrial vacancy rose 50 basis points in July to 9.0%. The vacancy rate is up 290 basis points year-over-year.
- Orange County, CA, charts the highest average in-place rent per square foot, while Dallas-Fort Worth and Houston each doubled their year-over-year pipelines, signaling a new expansion boom in the ‘Texas Triangle’.
8. COMMERCIAL PROPERTY PRICES
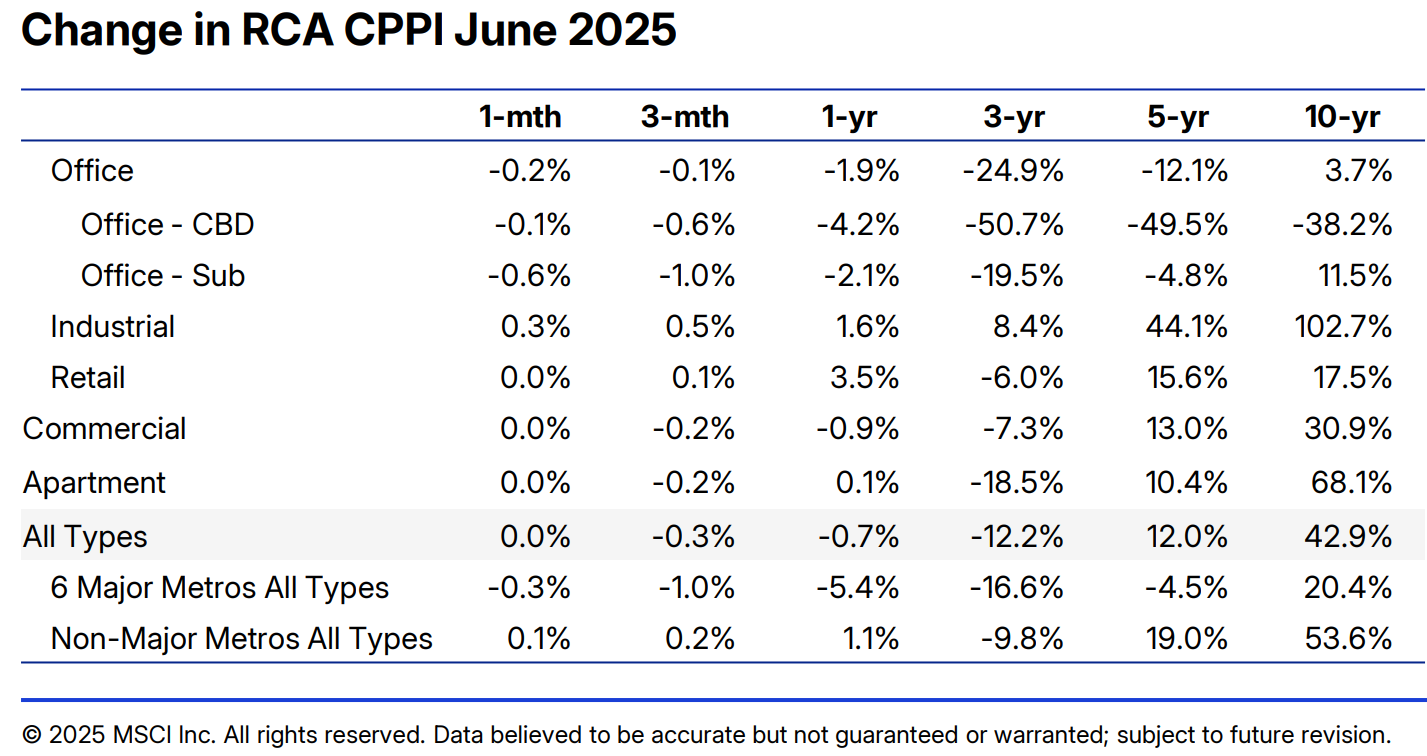
- Commercial property prices were mostly unchanged from June, according to MSCI-RCA’s Commercial Property Price Index; however, prices fell 0.7% year-over-year. The annual rate of decline has slowed substantially over the past two years.
- Retail properties continue to be the leading sector for price growth on an annual basis, climbing 3.5% year-over-year but flat from May.
- Industrial prices climbed 1.6% year-over-year and gained 0.3% from May. Monthly rates in the industrial sector have risen over the past three months.
- Apartment prices posted a 0.1% annual increase in June but were flat on a month-over-month basis.
- Office was the only major property type in June to post a year-over-year decline, falling 1.9% while dropping 0.2% from May.
9. CONSTRUCTION SPENDING
- According to the Census Bureau, US construction spending fell by 0.4% between May and June to a seasonally adjusted annualized rate of $2.13 billion—extending monthly declines that began last November.
- Construction spending has fallen this year as restrictive borrowing rates increasingly limit new real estate demand and curb credit activity for new projects.
- Residential construction plummeted by 0.7% in June to an annualized rate of $952 billion, while non-residential construction ticked lower by 0.1% to an annualized rate of $1.2 trillion.
10. BUILDER SENTIMENT
- Builder confidence in the single-family home market edged higher in July, according to the NAHB/Wells Fargo Housing Market Index.
- Current sales conditions rose marginally, while sales expectations for the next six months saw a higher boost. Reported traffic of prospective buyers fell slightly from June.
- 38% of builders reported cutting prices in July, the highest share since NAHB began tracking the figure on a monthly basis in 2022, following a previous record high in June. The share of builders cutting sales prices has gradually climbed over the past several months
- The average sales price reduction was 5% in July, on par with cuts seen since last November
SUMMARY OF SOURCES
1. FACTORY ACTIVITY EXPANSION
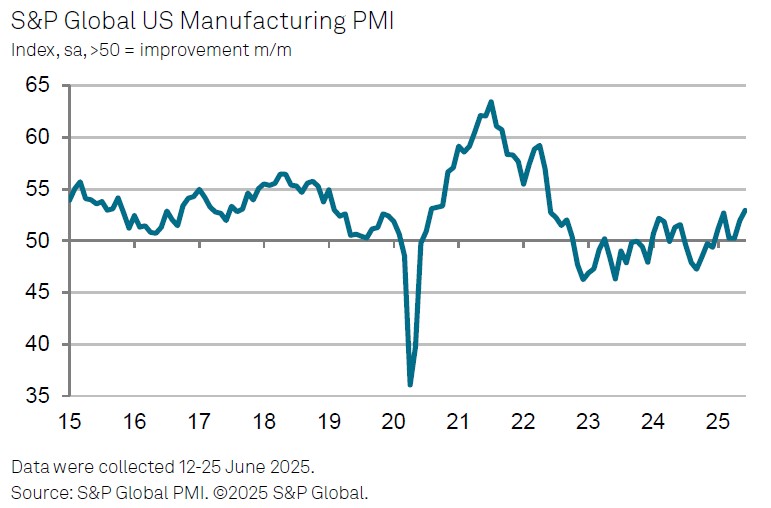
- US factory activity experienced its sharpest expansion in over three years during June, according to indicators from S&P Global and the US Census Bureau.
- According to the Census Bureau, new orders for manufactured goods increased by 8.2% in May and have risen in five of the past six months.
- More recently, the S&P Global US Manufacturing PMI indicates a significant expansion in US factory output during June, driven by a combination of increased new orders and a surge in exports.
- The Manufacturing PMI also indicates that higher demand for capacity prompted firms to increase staff the most since September 2022. Meanwhile, input costs accelerated the most on a monthly basis in nearly three years.
2. ONE BIG BEAUTIFUL BILL ACT AND CRE
- On July 4th, President Trump signed into law the ‘One Big Beautiful Bill Act’, a sprawling tax and spending bill with several provisions related to Commercial Real Estate but with complex, not easily defined implications.
- Key among them is the permanent establishment of Opportunity Zones, which will now operate in 10-year cycles with stricter eligibility requirements than previously.
- A return of 100% bonus depreciation has been celebrated by many in the real estate industry, expected to drive significant tax savings by enabling owners to deploy it strategically for certain building purchases and tenant improvements.
- The law also alters the calculation of Adjusted Taxable Income, allowing for the addition back of depreciation, amortization, and depletion, which is expected to increase the basis for deducting interest expenses.
- Others view the law as mostly neutral for Commercial Real Estate, with some increases in SALT deductions potentially becoming a boost to real estate values, while deep spending cuts could partly offset this with weakened demand.
3. GEOPOLITICAL RISKS
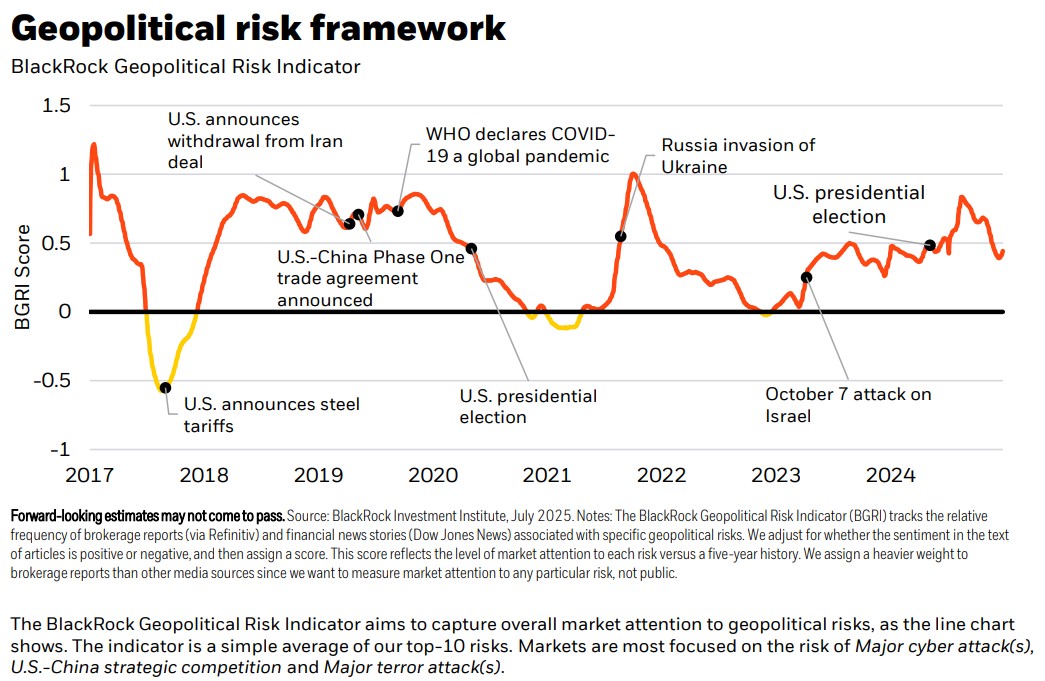
- According to BlackRock’s tracking of market attention to geopolitical risks, the risk of global trade protectionism remains the issue that drives the most attention from financial markets, out of those tracked. At the same time, concerns around the Middle East have increased in recent months.
- Uncertainty and volatility have dominated the geopolitical landscape in 2025, but have impacted markets to varying extents. Global trade risks remain the scenario most likely to materialize, as despite a pause to several tariffs and ongoing trade negotiations, the market expects effective tariff rates to stay above 2024 baselines.
- The outbreak of war between Israel and Iran in June, which saw direct US involvement, threatens both regional and global energy market stability. While a recent ceasefire has dampened market attention to these developments, BlackRock still views these risks as high, given the uncertainty surrounding damage to Iran’s nuclear program and the mutually incompatible red lines between the parties involved.
- The US-China strategic competition risk remains high despite some signs of progress on trade talks between the two nations in June. Both countries continue to take steps toward export controls and decoupling of key technology sectors, while hawkish sentiments in each government raise the chances of military miscalculation.
4. LOGISTICS ACTIVITY
- US logistics activity rose only modestly in June but reached its third-highest reading in the past two years, according to the latest reading of the Logistics Managers’ Index (LMI).
- Supply chain activity during the first half of 2025 has somewhat defied typical seasonal patterns. The only months when logistics activity expansion has been higher over the past two years were January and February of this year, which resulted from wholesalers rushing in new orders to get ahead of potential tariffs.
- While activity later reverted to its pre-January trend, it continued to expand healthily, growing in each month since March.
- June’s increase in the LMI was primarily driven by a sharp rise in inventory levels during the first half of the month as importers took advantage of a pause in many punitive tariffs.
- Inventory costs rose significantly as a result, reaching their highest level since October 2022, when supply chains were still dealing with COVID-related disruptions.
5. MORTGAGE APPLICATIONS RISE
- Mortgage applications soared by 9.4% during the week ending on July 4th, 2025, according to data from the Mortgage Bankers’ Association.
- Application volumes have now grown for three consecutive weeks, marking their longest streak of expansion since December 2024, at a time when benchmark mortgage rates were softening.
- Both refinance applications, which tend to be more sensitive to short-term interest rate changes, and purchase applications jumped by 9% during the week.
- Refinance applications are up 56% from the same time last year, while purchase activity is up 25%—a key signal that housing market activity is gradually thawing.
6. JUNE JOBS REPORT
- The US economy added 147,000 new jobs in June, narrowly above May’s revised total of 144,000 additions, according to the latest data from the Bureau of Labor Statistics (BLS). The unemployment rate ticked down to 4.1%.
- Job growth has been steady during the first half of 2025, proving resilient in the face of rising economic uncertainty over the past several months, including the rise of AI investment and increasing trade and geopolitical tensions.
- Following the release of the June jobs report, the probability of a July rate cut by the Federal Reserve reduced considerably. June’s job data appeared to validate policymakers’ wait-and-see approach further, causing futures markets to revert toward a projection of fewer and further-out rate cuts.
- However, the June jobs report showed government jobs accounted for a significant share of June’s growth, with strong state and local hiring leading to a 73,000 increase in public sector roles.
- The private sector still added 74,000 jobs in June, according to initial estimates. Still, these more subtle shifts in the labor market will be key to policymakers’ assessment of how rate policy should evolve.
7. COMMERCIAL PROPERTY PRICES
- Commercial property prices fell 0.2% month-over-month and 1.0% year-over-year in May, according to the latest Commercial Property Price Index (CPPI) update from MSCI-RCA.
- Nationally, commercial property prices extended a trend of mild annual decreases experienced over the past year, with the index posting its fifth consecutive monthly decline.
- Retail led all property types during May, rising 0.2% from April and 4.0% year-over-year. Retail prices have risen monthly for 12 consecutive months.
- Industrial prices declined by 0.2% and rose just 0.1% year-over-year as the sector’s post-pandemic momentum continues to fade. May marked the seventh consecutive monthly decline in industrial prices.
- Apartment prices fell 0.4% from April and experienced a 1.1% drop year-over-year. Declines in Apartment prices have moderated somewhat in the past year and are gradually trending more positively.
- The CBD Office sector continues to be the weakest tracked property sector, but the pace of decline eased in May. CBD office fell 0.4% from April and is down 6.2% year-over-year, a significant improvement over a nearly 30% decline this time last year.
- Suburban Office prices climbed 0.4% month-over-month and are up 1.5% year-over-year.
8. BUSINESS OPTIMISM
- Business optimism was mostly unchanged in June from a month prior but fell slightly below forecasts, according to the latest data from the National Association of Independent Business (NFIB)
- There was a substantial increase in respondents reporting excess inventories, which drove a slight decline in the overall index month-over-month. Meanwhile, the net percent of business owners expecting better business conditions also fell, dropping three points to 22%.
- The net percentage of owners expecting higher sales volumes ahead fell three points to 7%, while a net 21% of owners plan capital outlays in the next six months, down one point from May.
- Business uncertainty also declined in June, while the share of small business owners reporting taxes as their single most important problem rose 19%, its highest since July 2021.
9. CMBS DELINQUENCIES RISE
- According to Trepp, the CMBS delinquency rate rose five basis points to 7.13% in June, with four of the five main property types registering increases during the month.
- The highest delinquency rate increase during June was in the Office sector, which climbed 49 basis points to 11.09%, reaching a record high and surpassing previous peaks in July 2012 and December 2024.
- Lodging continued to display volatile delinquency trends, rising 42 basis points to 6.81% after shedding nearly 150 basis points during May, according to the report.
- The delinquency rate for Industrial loans ticked up just three basis points and remains at an industry low of 0.51%. The Retail delinquency rate climbed by five basis points to 6.69%.
- Multifamily loans were the only major property sector to buck the trend, with the delinquency rate falling by 20 basis points from May.
10. APARTMENT SUPPLY TRENDS
- A new analysis by RealPage suggests that many large construction markets have reached their peak, but that at least 13 of the nation’s 50 largest apartment markets won’t reach their highest supply volumes until at least the second half of 2024.
- The report identifies Boston, Detroit, Fort Lauderdale, Kansas City, and Memphis as metros expected to hit their construction peaks during the third quarter of this year. Cleveland, Columbus, and New York are expected to peak during the fourth quarter.
- Looking ahead to 2026, Newark is expected to reach its high during Q1, while Anaheim, Los Angeles, and San Diego are projected to reach their supply peaks in Q2. Finally, Greensboro, NC, is expected to peak during Q3 2026.
SUMMARY OF SOURCES
1. FED INTEREST RATE DECISION
- The Federal Reserve’s FOMC held rates unchanged at 4.25%-4.50% during its May policy meeting, aligning with market expectations leading up to the decision.
- While markets and experts largely expected the FOMC to keep rates steady in May, some expressed concern about leading anecdotal data, such as the Beige book, recently pointing to deteriorating conditions in the labor market, arguing that there could be room for a pre-emptive rate cut.
- However, despite Fed Chair Jerome Powell referencing the “great deal of uncertainty” around tariffs during his post-meeting press conference, he said that policymakers need not “be in a hurry to adjust its monetary policy” and that to wait-and-see remains “the appropriate thing to do.”
- Notably, within a few days of the May FOMC meeting, the Trump administration announced a 90-day pause on its ‘reciprocal tariffs’ against China. As a result, the CME fed futures markets are, on average, forecasting delayed and fewer rate cuts in 2025 relative to before the announcement of a tariff pause.
2. CPI INFLATION
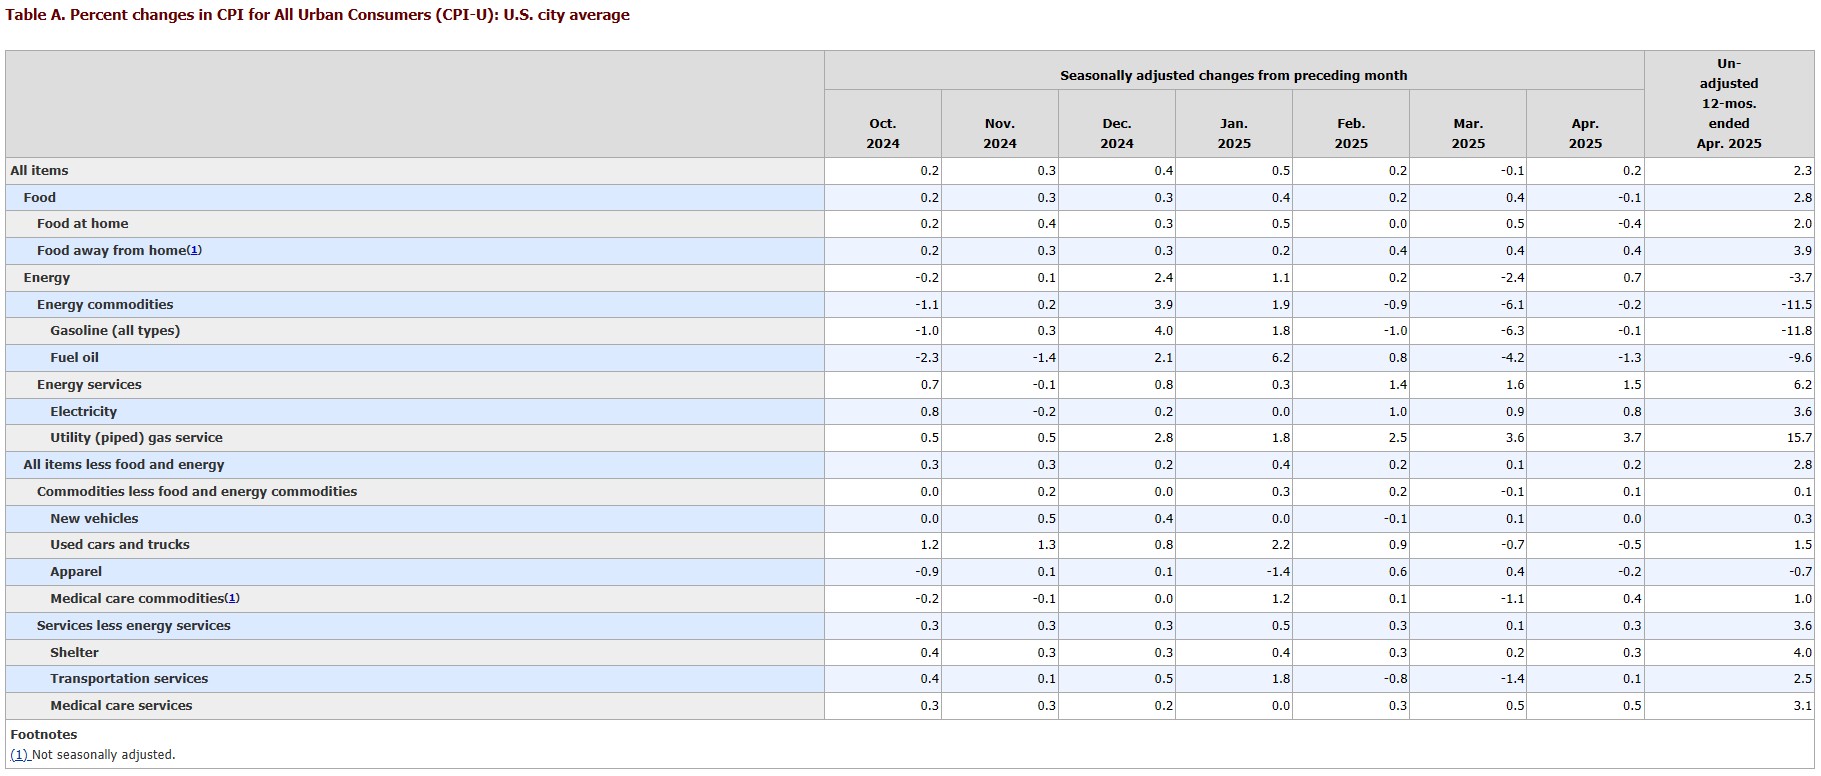
- CPI inflation eased on an annual basis to 2.3% in April, its lowest annual reading since February 2021. Prices climbed 0.2% on the month.
- Core CPI prices increased 0.2% month-over-month and 2.8% year-over-year.
- While monthly readings edged higher compared to March, they largely fell short of market expectations and were seen as a positive sign in the face of fear of potential tariff-induced inflation.
- Shelter costs rose 0.3% during the month, accounting for more than half of the monthly gain in headline CPI.
- Energy prices rose by 0.7% month-over-month, driven by a rise in natural gas and electricity costs, while gasoline prices declined. Meanwhile, food prices fell by 0.1% in March.
3. SMALL BUSINESS OPTIMISM
- Small business optimism declined in April, according to seasonally adjusted data from the National Federation for Independent Businesses (NFIB).
- Optimism remained below its historical average for a second consecutive month as fewer owners expect to increase business investments in the near term.
- The net share of small business owners who expect better business conditions fell six points to a net 15% in April, its lowest share since October 2024.
- 34% of business owners expressed doubt in their ability to fill existing job openings, down percentage points from March. Interestingly, job openings are at their lowest level since January 2021.
- A net -4% of owners plan inventory investment in the coming months, down three points from March and its lowest reading since June of last year.
- 18% of owners are planning capital outlays in the next six months, down three points from March and its lowest since the depth of the COVID-19 pandemic in 2020.
- The most recent survey, conducted in April, does not capture the effect of the Administration’s announcement of a pause in its China tariff policy, which could meaningfully boost sentiment in the coming weeks.
4. CONSUMER CONFIDENCE
- According to data from the Conference Board, consumer confidence fell by 7.9 points in April to an index level of 86.0, its fifth consecutive monthly decline.
- Both consumers’ assessment of current business conditions and their short-term outlook for conditions shifted toward the downside, with the expectations index reaching a 13-year low.
- Forward-looking expectations deteriorated across the board, including expectations regarding future business conditions, employment prospects, and future income.
- Further, the share of consumers who expect fewer jobs in the next six months sits at 32.1%, roughly as high as in the middle of the Great Recession.
- The fall in consumer confidence was also broad demographically, falling amongst all age and most income groups and shared across all political affiliations.
- The decline was sharpest among consumers 35-55 years old and those making more than $125,00 per year.
5. CONSTRUCTION SPENDING
- US construction spending shrank by a seasonally adjusted 0.5% month-over-month in March, according to the latest available data from the US Census Bureau.
- High mortgage rates and tariffs on imports contributed to both a supply and demand-driven increase in construction costs, constraining homebuilding activity during the month.
- Private sector spending fell 0.6% in March, driven by pull-backs in both non-residential investment (-0.8%) and residential investment (-0.4%).
- Public sector spending fell 0.2%, primarily due to a fall in non-residential investment and reduced spending on power, commercial, and amusement and recreation construction. Office and transportation construction experienced some of March’s most significant spending increases.
- Annually, US construction spending is up 2.8% through March.
6. SPECIAL SERVICING RISES IN APRIL
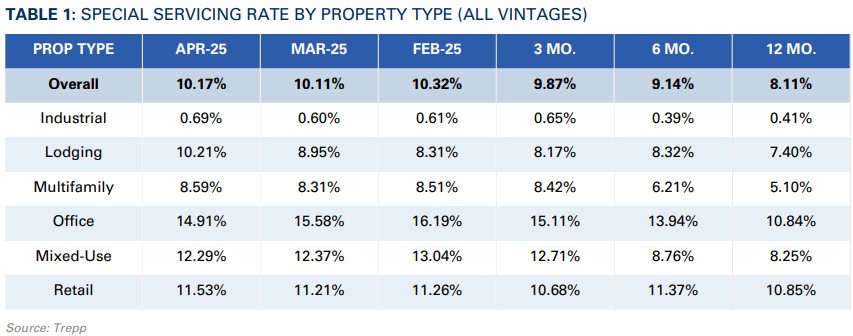
- According to Trepp, the special servicing rate for CMBS loans rose six basis points (bps) to 10.17% in April.
- While April’s increase was relatively modest, the industry-wide special servicing rate sits well above the 8.11% charted one year ago and the 5.62% registered in April 2023.
- There were significant variations in sector-level performance during the month. Lodging continued to chart the most significant increase, climbing 126 bps to 10.21% in April and following a 64 basis point jump in March.
- Multifamily and Retail also saw special servicing rates climb during the month, rising roughly 30 basis points each. Industrial rose just nine bps.
- Office saw some relief as its rate dropped by 68 basis points, a repeat of March, to 14.91%.
7. LOGISTICS MANAGERS’ INDEX
- Logistics activity rose in April following a slowdown in March, according to the latest reading of the Logistics Managers’ Index.
- Logistics activity was elevated to start the year as North American firms attempted to front-run a potential trade war before snapping back in March. April’s rebound reflects a growth level more consistent with logistics sector performance before the 2024 Presidential Election.
- Inventory levels rose but at a much slower pace compared to activity experienced during the first quarter, reflecting a more normal seasonal inventory buildup.
- Despite lower inventory growth, warehousing prices and inventory costs climbed faster than the previous month, suggesting that much of the first-quarter inventory buildup remains sitting in storage facilities.
8. COMMERCIAL PROPERTY PRICES
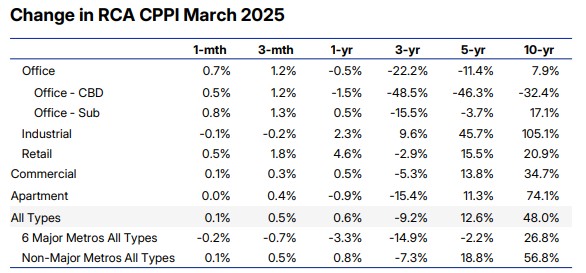
- Commercial property prices rose 0.6% year-over-year in March as commercial real estate gradually edges into a faster pace of annualized growth. Further, a quarter-over-quarter gain of 0.5% during Q1 puts the pace of annualized growth at 1.8%.
- According to the monthly update by MSCI-Real Capital Analytics, CRE prices have not yet responded to the spike in uncertainty that has accompanied recent trade negotiations and policy rollouts.
- Rather, CRE still exhibits the uneven price performance across sectors that has persistent since 2022.
- Retail led all sectors during Q1, rising 1.8% from Q4 2025 and 4.6% year-over-year.
- Industrial, which has typically seen the strongest price growth of any sector during the post-pandemic period, followed Retail with a 2.3% year-over-year increase during Q1 but declined 0.2% from Q4.
- Apartment prices declined 0.9% year-over-year during Q1 but climbed 0.4% quarter-over-quarter, its second consecutive quarter of growth, suggesting that price stagnation is gradually thawing in the sector.
- CBD office prices were down just 1.5% year-over-year in Q1, a significant turnaround from the more than 30% recorded one year ago. Suburban office prices rose 0.5% year-over-year during Q1.
9. GDP
- Real US GDP contracted at an annualized rate of 0.3% during the first quarter of 2025, based on the advance estimate from the US Bureau of Economic Analysis.
- The first-quarter decline was primarily due to a sharp increase in imports, which is a negative factor in the GDP calculation. GDP’s other components—consumer spending, investment, and exports—each also increased, partly offsetting the downside effect of imports.
- Beneath the surface, the US economy still exhibits strong fundamentals. The rise in imports during the first quarter was significantly driven by US firms and consumers, who front-loaded their purchases of goods in anticipation of the Trump Administration’s tariffs.
- It reflects robust consumer spending despite softening consumer sentiment. Nonetheless, the first-quarter numbers indicate that consumers and producers significantly adjusted their activities in anticipation of heightened trade tensions.
10. APRIL JOBS REPORT
- The US Economy added 177k payrolls in April, above consensus estimates of 130k, according to the Bureau of Labor Statistics (BLS). The unemployment rate was unchanged at 4.2%.
- It was a strong showing for firms despite being a month headlined by heightened economic uncertainty and volatility. April’s job growth slightly edged out the average monthly increase of 152k over the previous 12 months.
- Payrolls grew the most in the healthcare sector (+51k), transportation and warehousing (+29k), and financial activities (+14k). The increase in transportation and warehousing employment comes after little change in March and arrives after an uptick in logistics activity, including imports and inventories, to start the year. Federal government employment continued to decline (-9k).
SUMMARY OF SOURCES

SHAREABLE FLIPBOOK DOWNLOADABLE PDF
1. SMALL BUSINESS OPTIMISM DECLINES
- According to the National Association of Independent Business (NFIB) in March, small business optimism experienced its most substantial decline in nearly three years, driven by a collapse in expectations around future business and sales conditions.
- The share of owners who expect better future business conditions fell by its largest monthly amount since December 2020, declining to just 21%. Meanwhile, just 3% of owners expect real sales to be higher in the short term, down from 14% in February.
- Notably, the identical items that saw the largest boost to sentiment following the November 2024 election experienced the steepest declines in March.
- Other components that measure ongoing business conditions, such as the share of owners reporting plans to increase employment, capital outlays, or expand their business, remain roughly in line with where it was pre-election.
2. CONSUMER CONFIDENCE TRACKING
- Morning Consult’s daily index of consumer sentiment (ICS) shows that from April 3rd to April 7th, consumer confidence experienced its second-largest three-day drop since tracking began in 2018, behind only reactions to the onset of COVID-19 in March 2020.
- The April 7th reading was the lowest since July 2024. Following the 2024 election, US consumer confidence experienced a rapid upswing, reaching a five-year high by January 21st, but has fallen steadily in the past several weeks.
- Consumer and business confidence indices have recently reacted to the US administration’s tariff announcements, but the impact on spending is less clear. Consumer spending was weaker than expected in February, but some forecasters foresee an Easter spending pick-up despite higher uncertainty.
3. LOGISTICS MANAGERS’ INDEX
- The US Logistics Managers’ Index (LMI), a leading indicator for Industrial Real Estate activity, fell from 62.8 in February to 57.1 in March. A mark above 50 indicates that logistics activity is expanding.
- This month’s drop is the third largest in the index’s history and marked the shortest expansion in logistics activity in seven months. However, for context, February’s LMI reading was the highest since June 2022.
- The decline was led by an across-the-board drop in index components prices, including inventory costs, warehouse prices, and transportation prices.
- The broad price decrease lends credibility to the view that logistics activity ramped up to start the year in anticipation of tariff risks, but that activity has since subsided.
- Additionally, inventory levels and warehouse and transportation capacity each expanded at a slower pace in March.
4. MEDICAL OUTPATIENT SPACES
- Medical outpatient buildings (MOB) are emerging as an opportunity in an otherwise challenging market, as explored in a recent piece by Globe Street.
- Asking rents rose 2.5% in 2024, slower than the 3.7% in 2023, but premium properties continue to drive rent growth in the sector.
- Properties with rents in the 90th percentile of Revista’s top 100 markets achieved an average of 2.4% in NOI growth between 2019 and 2024 compared to an average of 1.8% growth for properties near the 50th percentile.
- Tenant retention has also been key to MOB’s appeal. Healthcare providers typically operate on longer lease terms while renewing at high rates.
- According to data from Green Street, over 80% of tenants renewed MOBs in Q3 2024. New leases average a commitment of 107 months, nearly nine years. Meanwhile, vacancy rates remain relatively low, at just 6.9% through Q4 2024.
5. APARTMENT CONSTRUCTION & DEVELOPMENT ACTIVITY
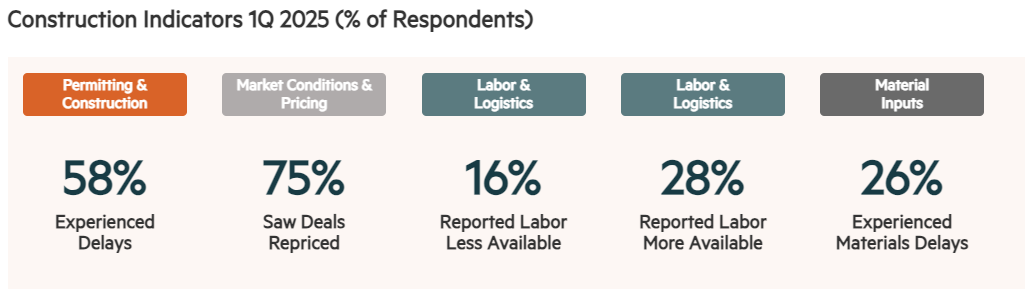
- According to the National Multifamily Housing Council (NMHC)’s latest quarterly construction survey, 58% of respondents reported experiencing construction delays during the first quarter, down from 78% at the end of Q4 2024.
- The Southeast stands out as an area where delays are more widespread, followed by Texas and, to a slightly lesser extent, the mid-Atlantic and the Rockies.
- Of those experiencing delays during Q1, 79% are experiencing permitting delays, a drop from a record high of 95% of respondents in Q4 2024. The share of respondents reporting delays in starts rose from 90% to 93%, its highest share since June 2022.
- The most frequently cited causes of delays in starting during the first quarter were economic uncertainty and economic feasibility, each at 68% of respondents. Permitting, entitlement, and professional services are also cited to a slightly lesser extent but still affect more than half of all respondents.
- Availability of construction financing and staffing shortages continue to decline as reasons for delayed starts.
6. MARCH JOBS REPORT
- According to the Bureau of Labor Statistics (BLS), the US added 228k jobs in March, well above projections of 140k jobs and climbing from 117k in February. The unemployment rate increased 10 basis points (bps) to 4.2%.
- Health care, transportation, and warehousing were once again among the key sectors driving employment growth.
- Federal government jobs continued to shrink in March as large cuts to the federal workforce that began in February continued to take shape. Federal government jobs declined by 4,000 in March following an 11,000 decline in February.
- Despite payrolls coming in higher than expected, futures markets shifted toward a more dovish outlook for policy following the data release.
- Year-end projections for the Federal Funds rate went from a 78.7% probability of no more than four (4) rate cuts between now and the end of the year to a 51.1% probability of at least five rate cuts.
7. EASTER SHOPPING SEASON
- The National Retail Federation projects that Easter shoppers are expected to spend $23.6 billion during the spring 2025 holiday, up from the $22.4 billion estimated total in 2024.
- The report forecasts that Americans will increase their spending this year despite a recent uptick in economic uncertainty.
- Discount stores are expected to once again be the top destination for seasonal shopping. The price of eggs, a traditional item used for Easter festivities, has nearly doubled in the past year.
- Major retailers, who experienced robust sales numbers during the December 2024 holiday season, are expecting a similar pattern during the upcoming holiday, believing that consumers who feel constrained by other costs may view the holiday season more favorably.
8. TOP STATES FOR UNDER-35 HOMEOWNERS
- According to a Chandan Economics analysis of the American Community Survey, Texas, California, and Florida have the greatest number of households headed by someone under 35.
- Meanwhile, Utah (11.6%), Alaska (10.2%), and Iowa (10.1%) maintain the highest proportion of U35 homeowners as a share of all households in the nation, with North Dakota (10.0%) and Wyoming (9.6%) rounding out the top 5.
- The states with the highest totals tend to also have the most homeowners under 35 and generally rank near the top for renters.
- Conversely, the highest shares of U35 homeowners as a percent of all households reveal where young, first-time homebuyers face fewer barriers to ownership.
- States that rank in the bottom ten for a share of U35 homeowners are among some of the highest for average hourly wages. This includes DC, which is the lowest in terms of U35 homeowner share (3.5%) but highest in average hourly wage ($55.02). Also ranking in the bottom five are California (4.6%) and New York (4.8%), followed by Hawaii (5.1%) and Nevada (5.4%).
9. WFH RENTAL DEMAND
- According to a Chandan Economics analysis of the US Census Bureau’s American Community Survey, there are 4.0 million rental units in the US headed by someone who works from home (WFH), down from 4.5 million in 2022, representing a 9.9% decline.
- It’s the second consecutive year that WFH rentals have fallen, following the peak of 5.0 million households in 2021. Between 2021 and 2023, WFH rental demand has slid by a total of 1.0 million households (-20.1%).
- WFH renters skyrocketed by more than 200% in 2020 and rose again by about 18% in 2021.
- Despite the past two years of declines, the nature of remote vs. in-person work remains in a very different place than it was entering the pandemic. Through 2023, the total number of full-time WFH workers (22.6 million) remains up by 152% compared to pre-pandemic.
- The disentanglement of local rent prices from local wage dynamics had a major impact on rental markets in the aftermath of the pandemic. Now, while the reversion process will be more gradual, a re-anchoring appears underway.
10. FOMC MEETING MINUTES
- According to the recently released minutes from the Fed’s March policy meeting, there was broad agreement to keep rates unchanged while policymakers continue to assess the outlook for labor markets and growth in 2025.
- Members, on average, expect inflation to be pushed higher this year due to the impact of tariffs. However, the committee collectively acknowledges that there is much uncertainty around the magnitude of tariff effects or their duration.
- Meanwhile, a majority of officials believe that inflation pressures more broadly could be more persistent than previously anticipated.
- Most FOMC members view inflation risks as tilted to the upside, while employment risks are facing the downside.
SUMMARY OF SOURCES
1. CPI INFLATION
- The Consumer Price Index (CPI) rose 0.2% in February and 2.8% year-over-year, cooling more than expected and potentially providing some relief to markets and policymakers on guard about price pressures.
- Core-CPI, which removes the more volatile food and energy components, mirrored the headline 0.2% month-over-month figure but arrived slightly higher on an annual basis at 3.1%. Nonetheless, Core CPI also fell short of Wall Street’s consensus forecast, with economists expecting a 0.3% month-over-month increase in both the headline and core numbers.
- Shelter costs notably decelerated from January (+0.35 month-over-month) but remain responsible for roughly half the monthly increase in headline CPI. Further, since shelter makes up about one-third of the CPI weight, it managed to push core inflation above the headline metric this month even as food and energy prices were on the rise.
- Food and energy prices each rose by 0.2% in February, with eggs soaring another 10.4% in the month—taking its 12-month increase to a massive 58.8%. Beef prices also rose 2.4%
- This month’s CPI release comes amid a flurry of economic policy moves by the White House that could have both short- and long-term implications on growth and inflation. Both stock market futures and treasury yields rose following the Wednesday CPI release.
2. BUSINESS OPTIMISM DECLINES
- Business optimism took a significant dive in February, according to the National Federation of Independent Businesses (NFIB). The Business Optimism Index fell 2.1 points from January, which puts it at its lowest level since October, just prior to the 2024 presidential election.
- Also notable, a supplemental indicator of the index that measures uncertainty has surged to its second-highest level on record, beaten only by the initial uncertainty surrounding COVID-19.
- Expectations for the next six months declined, as did the share of business owners who believe now is a good time to expand their business. Labor quality and inflation continue to be the main concerns of business owners.
3. TARIFFS, UNCERTAINTY, AND REAL ESTATE
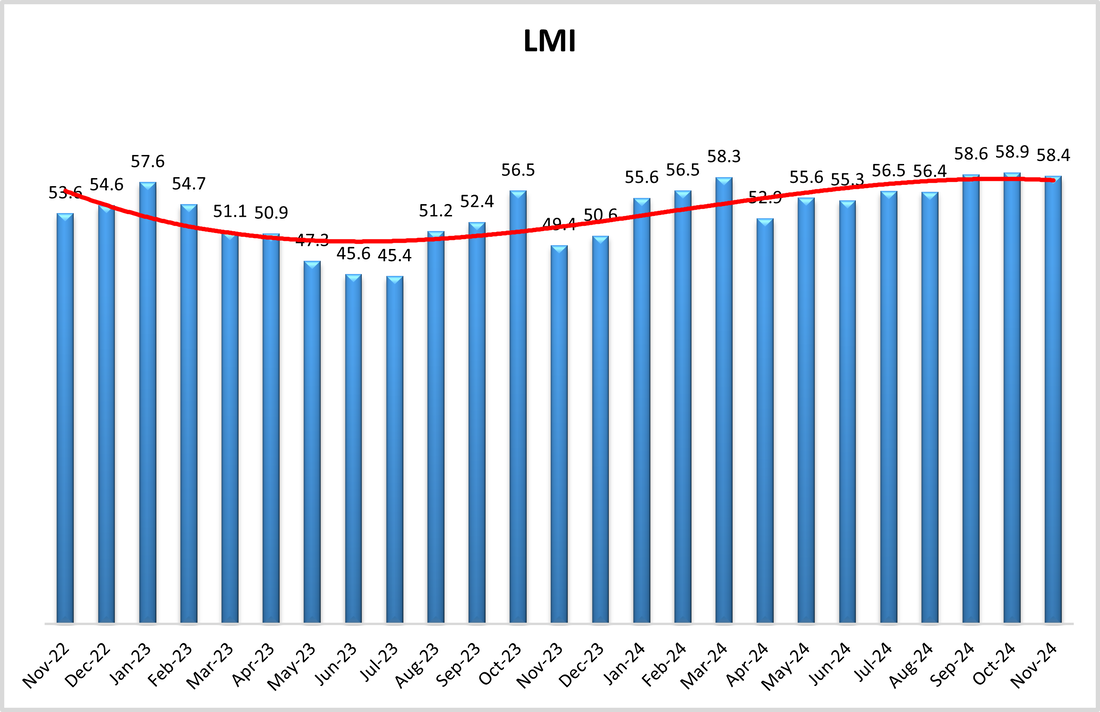
- The US Logistics Managers’ Index (LMI) came in at 58.4 in November, a slight downtick from October’s level but marking the 12th consecutive month of growth for the logistics industry. Logistics activity is a leading indicator of Industrial Real Estate demand.
- Inventory levels were down, in line with seasonal patterns, which saw warehouse utilization fall and capacity rise. The drop off in inventory also caused transportation capacity to expand and prices to fall.
- According to the reporting, inventory costs and warehousing prices saw the fastest growth, reflecting higher costs as more inventory is now held closer to consumers.
4. MARCH JOBS REPORT
- According to the Bureau of Labor Statistics, the US economy added 151k jobs in February, a rebound from a downwardly revised 125k additions in January but short of the 170k job additions that were expected.
- Job growth in health care, finance, as well as transportation and warehousing led job growth for the month, while federal government and retail trade drops saw some of the most notable declines.
- Average hourly earnings rose 0.3% month-over-month and rose annually by 4%.
- Treasury yields fell slightly, and fed futures forecasts consolidated around a projection of two rate cuts in 2025. However, with a flurry of economics-related developments arriving in the days since, the jobs data had little lasting impact on markets.
5. COMMERCIAL PROPERTY PRICES
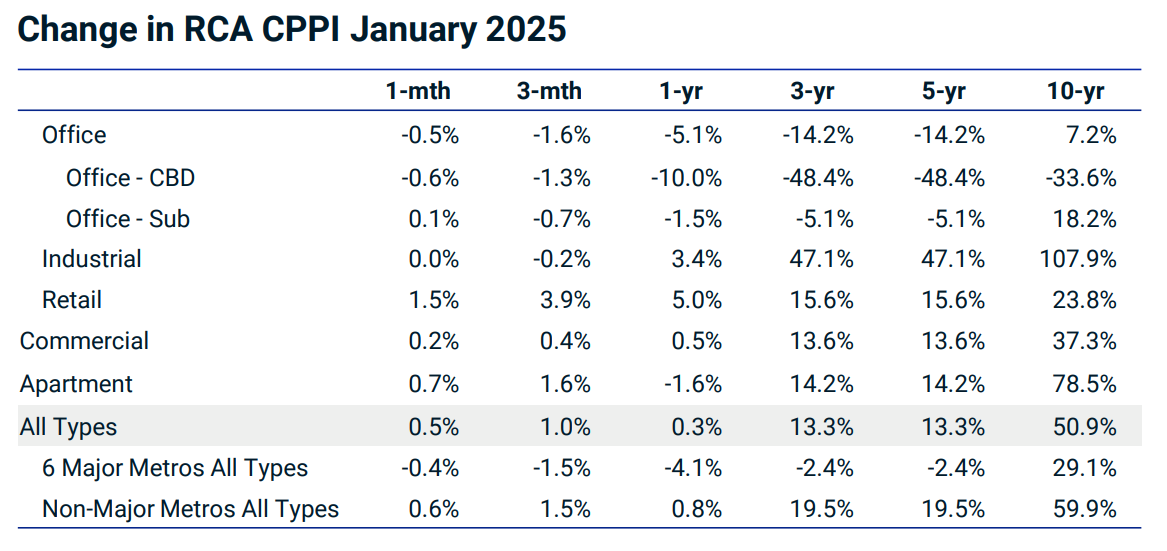
- Commercial real estate prices edged into year-over-year growth in January and posted their third consecutive monthly increase, according to the latest Commercial Property Price Index (CPPI) data from MSCI-RCA.
- Overall, commercial prices are up 0.5% from December and 0.3% over the past twelve months. Moreover, monthly price growth is accelerating, implying a faster annualized growth pace if the trend continues.
- The Retail sector led all property types in price momentum during both January and over the past year, rising 1.5% and 3.8%, respectively.
- Prices in the Industrial sector were unchanged on a monthly basis but Industrial joined Retail as the only property type to experience an annual increase in prices through January, climbing 3.4%.
- Apartment prices in the CPPI rose 0.7% in January, and though still negative year over year, the sector is gradually beginning to show positive momentum since prices hit a floor in August 2024.
- CBD office properties fell 0.6% from December despite signs during the fourth quarter that price declines were slowing. Suburban office prices are up 0.1% month over month and down 1.5% year over year.
6. FALLING CRE DISTRESS
- According to reporting from CRED iQ, distress for both conduit and single-borrower large loan deal types dropped for the first time in five months during February.
- This comes after MSCI reported in its January US distress tracker, which combines delinquencies and special servicing rates, that levels had reached their highest in a decade.
- Distress levels dropped 70 basis points in January to 10.8%, breaking a streak of four consecutive highs.
- Office distress continues to climb, however, reaching 19.3%.
- Looking at the components of the distress metric, delinquencies, as measured by CRED iQ, fell from 8.9% to 8.0% in February. The special servicing rate dropped 20 basis points to 10.1%. For context, one year ago, the delinquency and special servicing rates were 5.4% and 7.0%, respectively.
- Among property types, self-storage saw the largest downward move, but this was caused by a $2 billion portfolio reaching maturity, drastically skewing results.
- Elsewhere, Industrial distress fell 110 basis points to a CRE-low 0.5%. Hotel distress fell 20 basis points to 10.2%, with Retail dropping by the same amount but hovering a bit higher at 10.7%. Multifamily distress rose 10 basis points to 13.0%.
7. LOGISTICS ACTIVITY
- Logistics activity rose for a second consecutive month in February and, like in January, charted its strongest growth since June 2022, according to the Logistics Mangers’ Index (LMI)
- A notable uptick in inventory levels drove logistics activity growth, with both upstream and downstream firms expanding. LMI researchers note that expanding inventories across the supply chain is similar to a dynamic observed last year, but overall, expansion levels are elevated.
- According to the report, February’s inventory increases were at least partially driven by shifting trade dynamics. As a result, inventory and warehousing prices rose at their fastest pace in several years.
- Further, transportation capacity started to loosen during the latter half of the month, suggesting that much of the trade-related inventory buildup occurred at the start of the month before becoming more static as uncertainty rose among firms and consumers.
8. CONSTRUCTION PLANNING ACTIVITY FLATTENS
- According to the Dodge Construction Network’s momentum index (DMI), construction activity grew 0.7% in February while planning activity moderated.
- Commercial planning rose 3.3% during the month, while institutional planning fell 4.6%, leading to a mostly flat period for overall activity.
- Data center activity is propping up growth in the overall DMI, which, according to the researchers, would have contracted by 2% in February if data center growth had been removed.
- Increased uncertainty around material prices and fiscal policies is believed to be weighing on planning decisions, but for now, existing plans are moving forward.
- On the commercial side, data center, traditional office building, and retail planning led gains, while weaker education planning placed downward pressure on industrial planning actvitiy.
- The DMI remains up 27% compared to one year ago, but this has been driven by the commercial segment, where activity is up 43% year-over-year, while the institutional segment is up by a tepid 2% over the same period.
9. HOUSEHOLD UTILITY COSTS
- According to a recent analysis by Chandan Economics, the average US renter household pays $220 per month in utilities, and the costs vary widely by property type.
- On an absolute basis, tenants living in single-family rentals (SFR) pay considerably more in average utilities—about $327 per month, 56% higher than the next closest property type.
- These higher costs are typical for homes with larger square footage, explaining the consistently higher totals for SFR, but utility costs remain higher for SFR even on a relative basis.
- Utilities account for 18.3% of gross SFR housing costs, but this figure falls to 14.8% for 2-4 family rentals, 10.5% for small multifamily units, and 7.9% for large multifamily units.
- Because larger property types have more unit density, average utility costs fall in absolute and relative terms due to synergies gained from shared walls and centralized energy systems, which allow for more energy efficiency.
- While technological advances have helped level the playing field across residential property types, density remains a powerful driver of efficiency and cost savings.
10. GEOGRAPHIC DIFFERENCES IN CREDIT ACCESS
- A recent study by the New York Federal Reserve finds that residents in urban areas, specifically West Coast metros, have better access to credit on average than residents of other regions of the country.
- The study reports that between 2018 and 2023, rural areas had consistently worse credit health than urban areas. Further, 85% of the top 25 cities for credit access were on the West Coast or in the region near Minneapolis.
- Outside of these regions, credit security was highest in and around Chicago, Indianapolis, Washington D.C., and Raleigh.
- Cities with the least credit access were more geographically distributed, but many were around former industrial towns, such as Detroit and Syracuse, or college towns, including Gainesville (FL), Tuscaloosa (AL), and College Station (TX). In the latter cases, a larger share of the population is made up of students who are less likely to have a credit history, explaining some of the pattern.
SUMMARY OF SOURCES
