
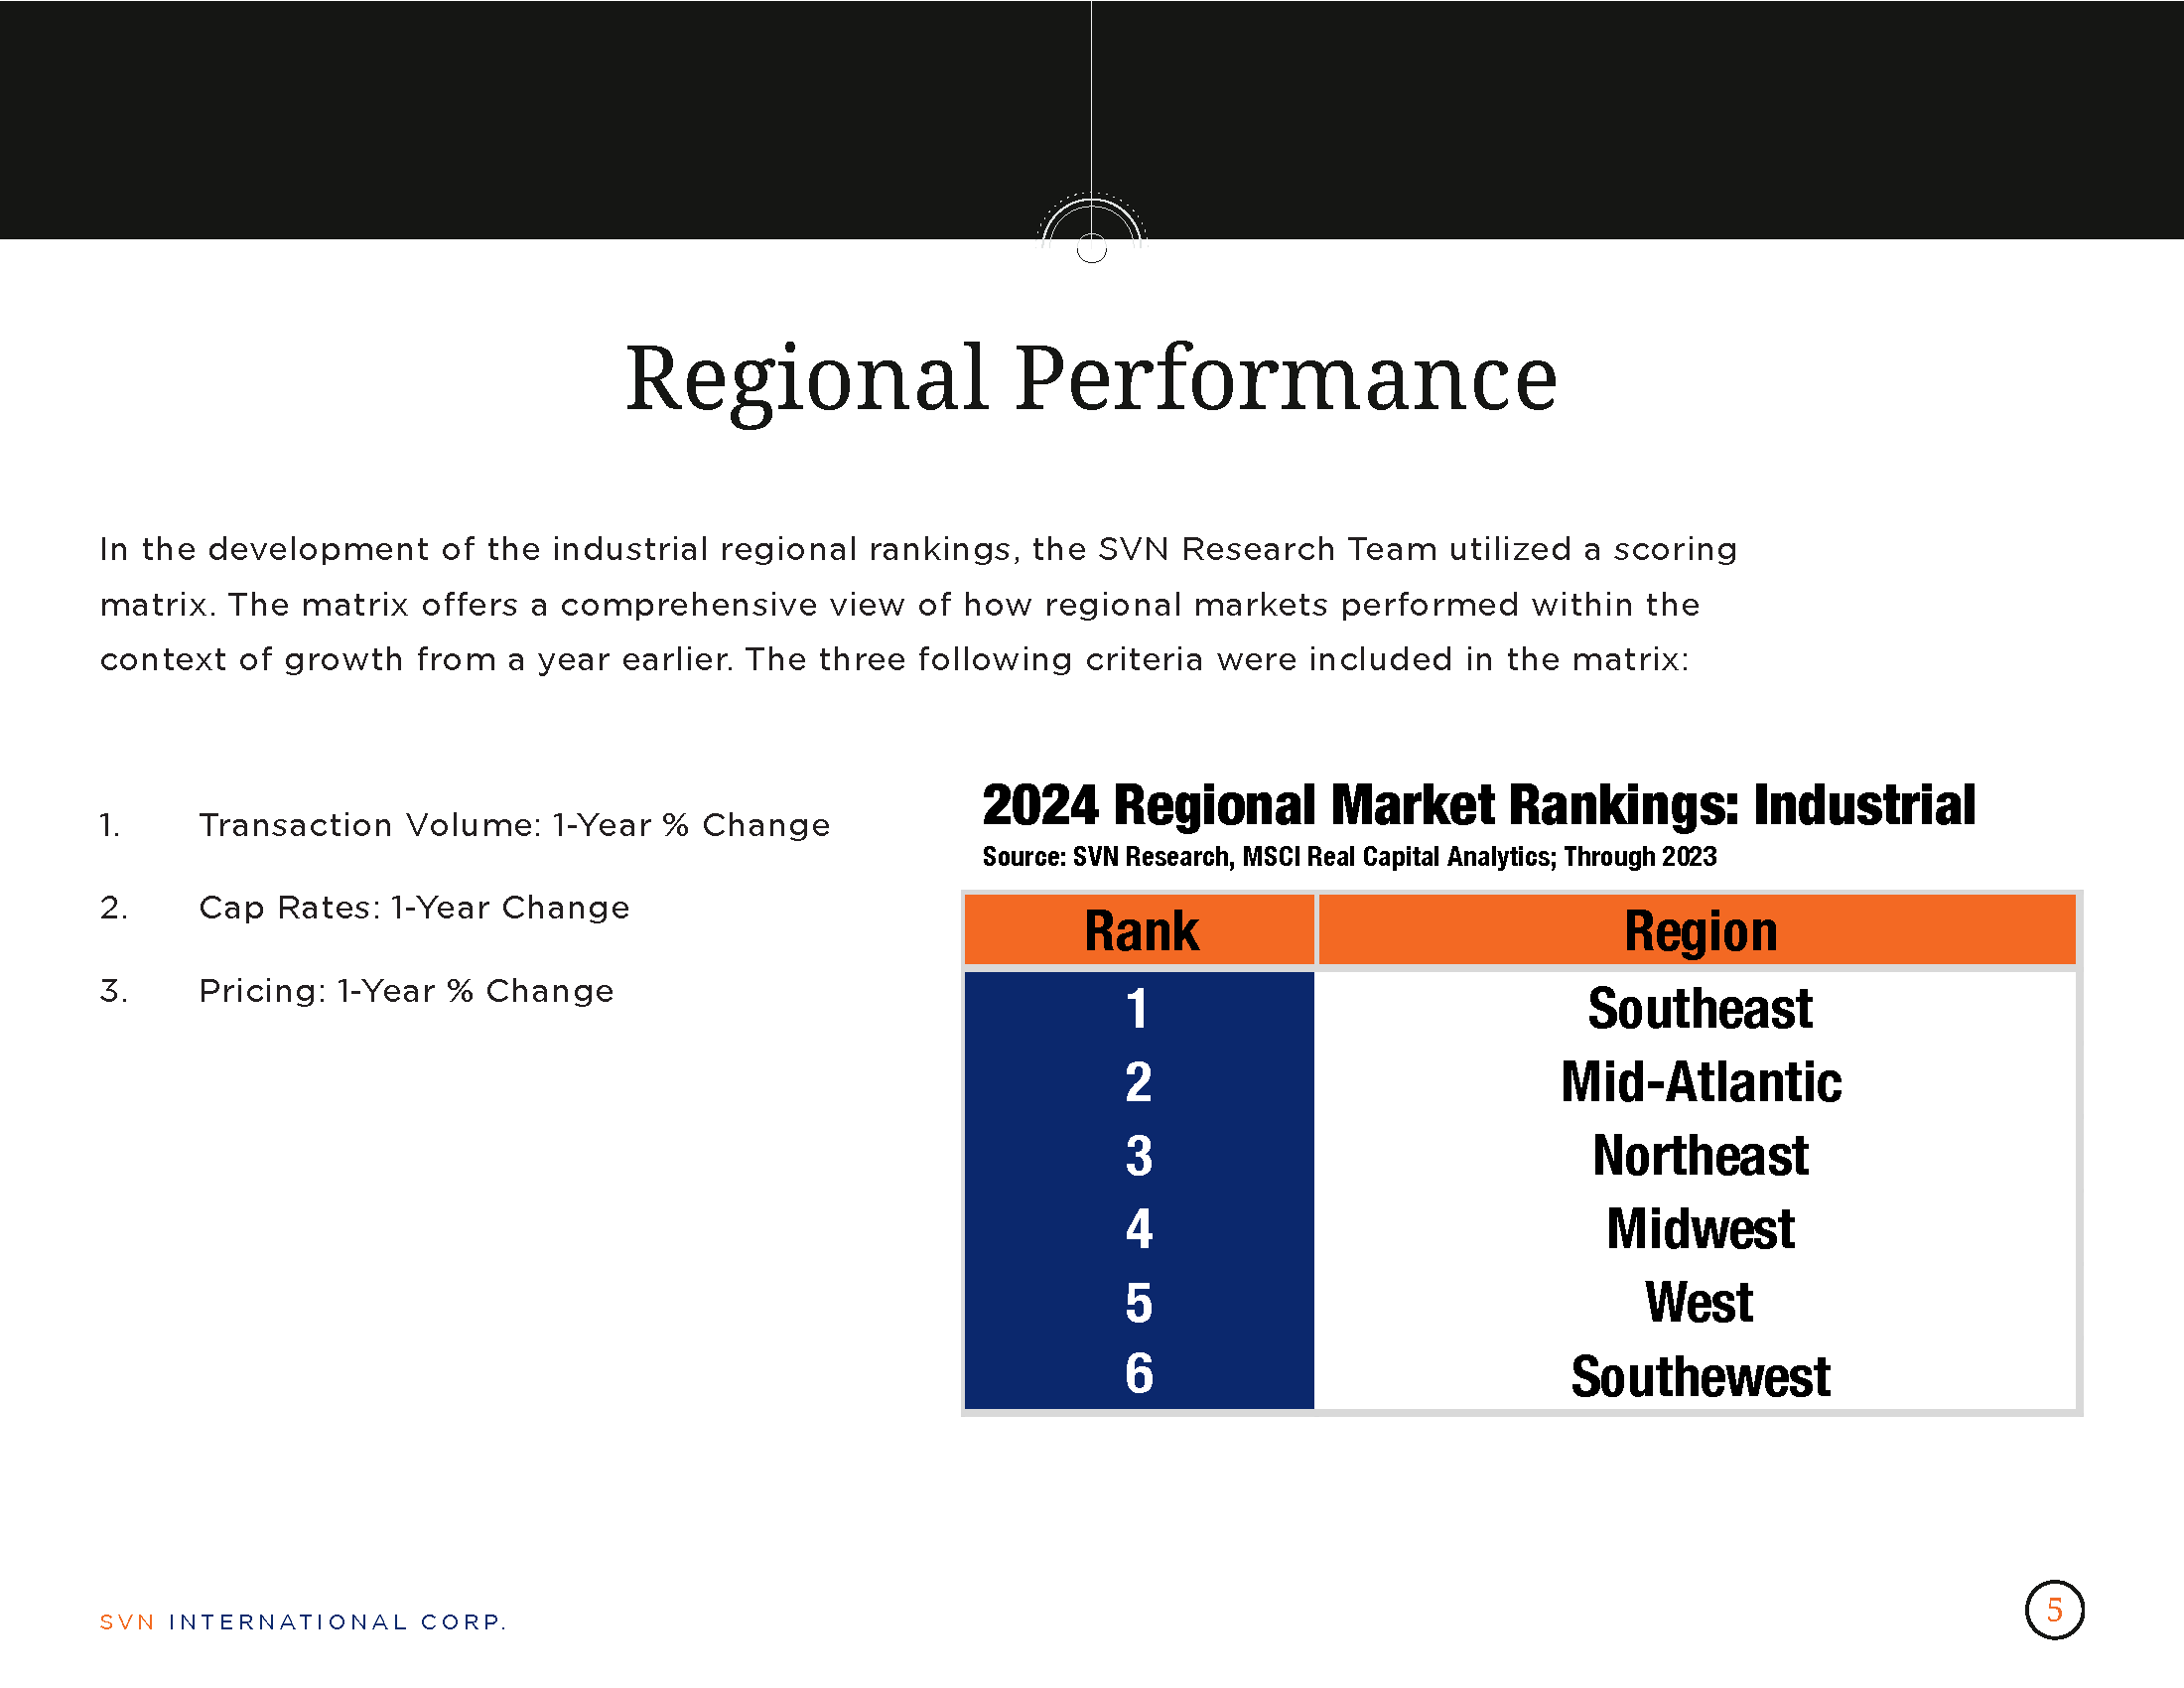


1. CURRENT ECONOMIC CONDITIONS (BEIGE BOOK)
- According to the March 6th, 2024, release of the Federal Reserve’s Beige Book, national economic activity increased over the previous six-week period.
- Eight of the twelve Federal Reserve districts reported slight to modest growth; three indicated soft growth, while one indicated a slight softening of growth.
- Consumer spending ticked down in recent weeks, led by a decline in the sale of retail goods. Further, consumers appear more price-sensitive and have shifted spending away from discretionary goods.
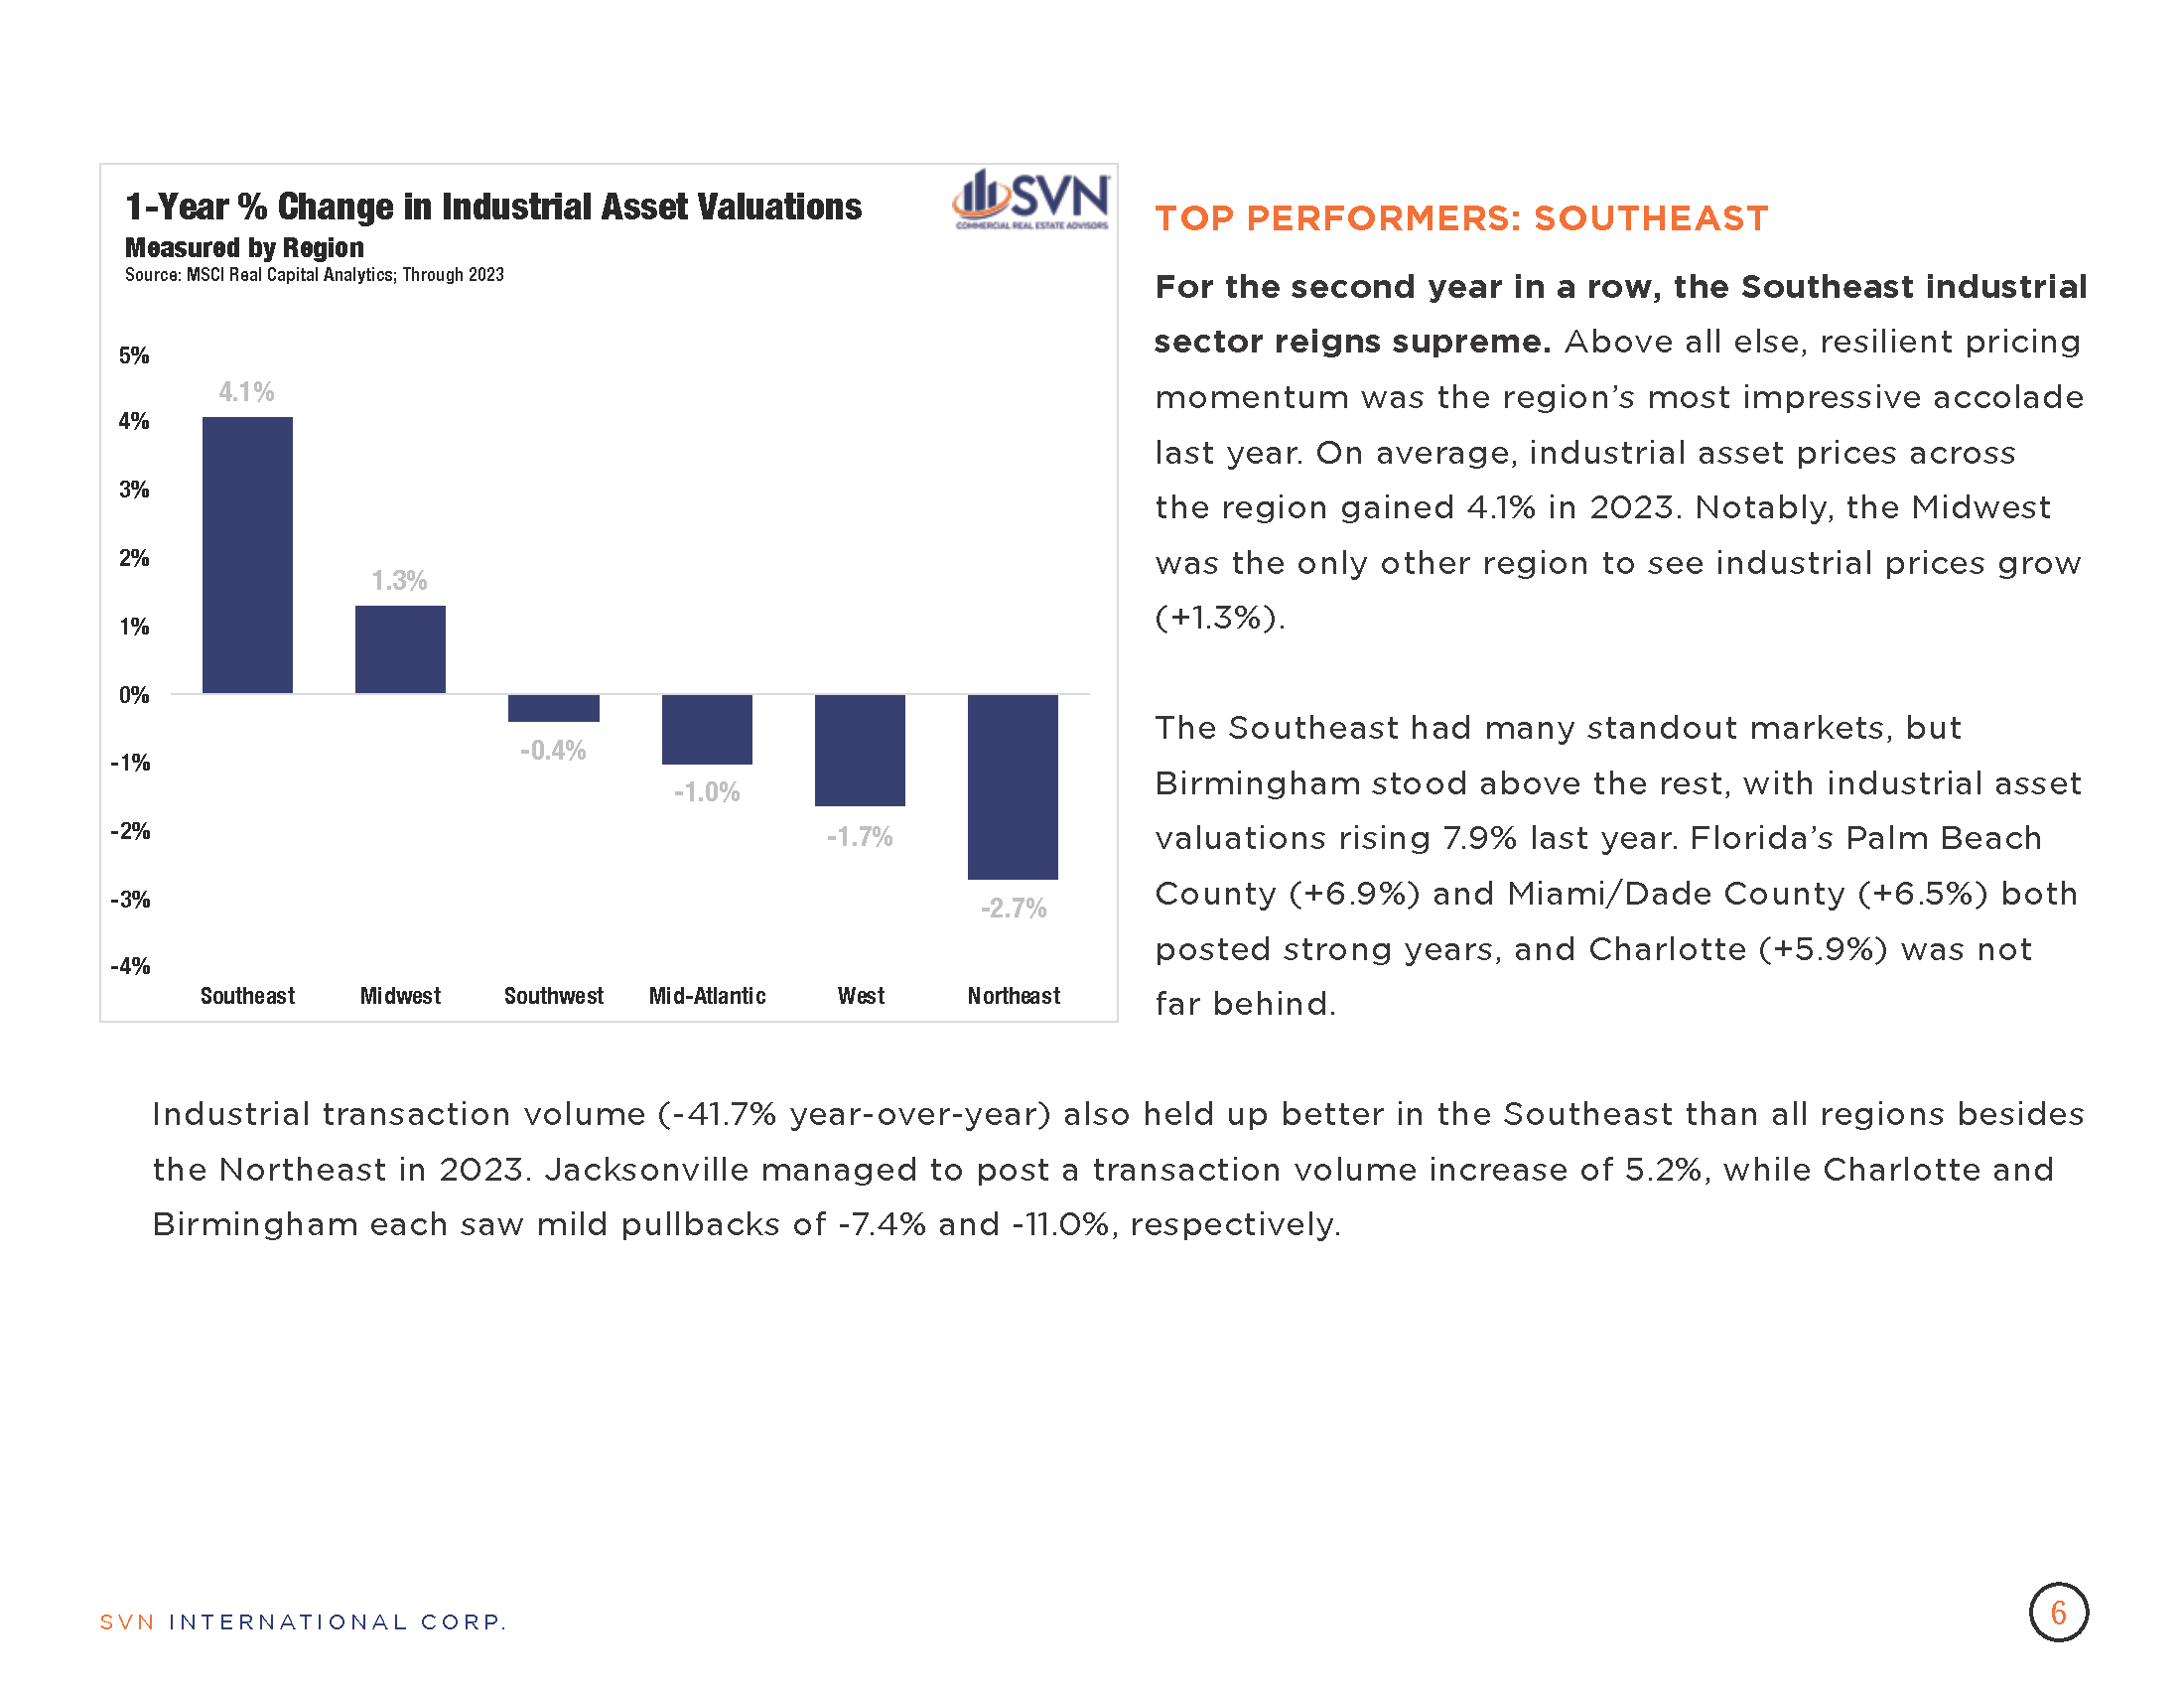
- Air travel was robust during the six-week period, while demand for restaurants, hotels, and other establishments softened as prices entered a seasonal uptick.
- Manufacturing activity was little changed while supply bottlenecks normalized. Delivery delays for electrical components and ongoing disruptions to the Red Sea and Panama Canal shipping continue but have generally not impacted domestic businesses during the reporting period.
- Demand for residential real estate rose during the period as mortgage rates moderated slightly. Commercial real estate activity was comparatively weak, though new demand for data centers, industrial and manufacturing spaces, and large infrastructure projects was notably robust.
2. CRE MARKET SENTIMENT
- A recent market sentiment survey from Bisnow/CohnReznick on CRE operators’ focus for 2024 covered industry viewpoints on capital markets, asset classes, geography, and operational outlook.
- A majority of respondents (41%) expect to deploy both equity and debt over the next 1-2 years—37.5% plan to finance mostly with debt, while 21.9% plan to finance with equity.
- According to the report, equity capital availability remains high, but winning and approving deals remain challenging. Private liquidity is plentiful, but matching investor preferences and yield opportunity remains challenging.
- Asset class sentiment is in line with the prevailing story, with multifamily and industrial dominating investor attention while the retail and hotel landscape remain favorable by most metrics. Office deals are getting done with much market-by-market variation, while high-quality build-to-rent developments continue to draw investor activity.
- Southeast markets continue to lead the charge nationally, particularly in South Florida, North Carolina, and the Nashville metro.
- Operationally, many CRE operators’ concerns centered around technological hurdles such as analytics and reporting, cybersecurity, and privacy.
3. WHITE HOUSE EFFORTS TO SUPPORT MANUFACTURED HOUSING
- In its recent press release, the White House announced new efforts to construct more residential units and lower housing costs, with a focus on manufactured housing.
- The administration plans to release $225 in funding to create and preserve manufactured housing communities. The Department of Housing and Urban Development (HUD) recently opened applications for grants to support the effort.
- A new FHA program will also be established to support the manufactured housing sector through financing, including increasing Title 1 Manufactured Housing program loan limits.
- According to a Bisnow analysis, demand for manufactured homes has skyrocketed since the pandemic. Nearly 22 million Americans now live in manufactured homes, and new shipments increased from roughly 94k in 202 to 113k in 2022.
4. SHIFTS IN INTEREST RATE FORECASTS
- Uncertainty surrounding US growth, labor markets, and inflation has complicated rate forecasts in recent weeks and recalibrated futures markets into a more hawkish stance than at the start of the year.
- Entering 2024, there was a near-uniform consensus (88.5%) that the FOMC would issue its first rate cut at its March policy meeting. Expectations have greatly adjusted over the past two months, and as of March 14th, futures markets place the likelihood of a March rate cut at just 1.0%.
- Stronger-than-expected labor market data over the past two months and signs that its effect on consumer demand remains robust have induced the hawkish U-turn. During Q4 2023, real US GDP increased at a 3.2% annual pace, while estimates from the Atlanta Fed’s GDPNowcast forecast that the economy will grow at a 2.3% annual pace in Q1 2024.
5. FEBRUARY JOBS REPORT
- According to the Bureau of Labor Statistics (BLS), the US economy added 275,000 jobs in February, beating estimates for the second consecutive month. Still, some labor market observers note that other indicators have signaled a cooling in market activity.
- The unemployment rate rose 20 basis points to 3.9% during the month, its highest rate since January 2022. Initial jobless claims have consistently beat estimates in recent weeks while wage growth has also slowed, a strong indicator of both labor market loosening and underlying inflation pressures. Further, the number of job openings per unemployed persons continues to decline.
- A sharp increase in construction, retail, and food service jobs propelled the higher-than-expected gain during the month while industries that more typically lead the charge, such as health care, leisure and hospitality, and government, continued to post the most significant monthly increases.
- The mixed signals emanating from February’s jobs report are testament to the difficult decisions facing the Federal Reserve ahead: the labor market appears to be moderating, but policymakers need more consistent data to move forward with a shift in interest rate policy.
6. CONSUMER SENTIMENT
- According to the latest estimate, the University of Michigan’s consumer sentiment edged lower in February to 76.9 from 79.0 in January. This largely signals that sentiment has held relatively steady in recent months, as the previous three marks for the index have coalesced around this level.
- Expected business conditions are significantly higher than in the fall of 2023, and all components of the index except for one have exceeded their mid-2021 levels, when, notably, pandemic-reopening efforts boosted sentiment numbers.
- Year-ahead inflation expectations edged higher from an expected 2.9% annual inflation rate to an expected 3.0% annual inflation rate. The subtle shift aligns with broader market forecasts over the past month that have moderated the dovish view that price pressures are behind us and rate cuts are imminent.
- Nonetheless, according to the survey’s analysis, shorter run inflation expectations have fallen to the 2.3%- 3.0% range last experienced between 2018 and 2019.
7. FED’S WALLER DOWNPLAYS CRE CRISIS
- In a late February statement, Federal Reserve Governor Christopher Waller said that while risk in commercial real estate is a concern, distress is emerging gradually and is unlikely to cause a crisis.
- Equity cushions could be substantial enough to bear the brunt of potential losses, while according to Paul Fiorilla of Yardi Matrix, the timeline for this development could take 2 to 3 years.
- Waller described the state of market risks as “predictable” and “manageable” and that banks have been preparing for losses, limiting system exposure to potential losses.
8. SPECIAL SERVICING RATES INCREASINGLY DIVERGE
- CMBS Special servicing rates climbed in January to 6.35% after falling slightly in December. It is the highest mark for the CMBS market since October 2021. However, property type performance remains increasingly mixed.
- Most sectors either sustained or amplified emerging trends, furthering the bifurcation of market performance.
- For example, special serving in the multifamily sector dropped sharply in January following more tepid declines to close to 2023. Similarly, following smaller increases in the prior months the office sector rate increased by 129 points. Altogether, three property types experienced absolute changes of 80 bps or more during the month.
9. CPI INFLATION
- According to the latest update from the Bureau of Labor Statistics, consumer prices rose by 0.4% in February and 3.2% over the past 12 months.
- The core Consumer Price Index (CPI), which excludes the more volatile measures of food and energy, also rose 0.4% monthly while charting a slightly higher 3.8% year-over-year.
- Energy and shelter price increases accounted for more than 60% of the total gain in headline CPI as gasoline jumped 3.8% on the month while the shelter measure increased by 0.4%.
- February’s CPI report could serve as hawkish fodder for policymakers who are concerned that, despite the reduction of price pressures, inflation remains above the Fed’s 2% annual target.
10. EXEMPTING AFFORDABLE HOUSING FROM BOND VOLUME CAPS
- The Federation of American Scientists (FAS) recently looked into the potential for exempting affordable housing projects from volume caps on tax-exempt Private Activity Bonds (PABs).
- The FAS argues that PABs are one of the primary financial tools for building and preserving affordable housing due to their relation to LIHTC financing. It says that lifting caps could speed up the development of badly needed housing.
- Their analysis showed that in 2020, 88% of PAB issuance went to multi- and single-family housing, continuing a decades-long upward trend as affordable housing demand climbs.
- Currently, exceptions exist for activities that contribute to public good, such as critical infrastructure project.
SUMMARY OF SOURCES
- (1) https://www.federalreserve.gov/monetarypolicy/beigebook202402-summary.htm
- (2) https://www.bisnow.com/national/news/capital-markets/asset-classes-markets-operational-concerns-bisnow-survey-reveals-cre-focus-for-2024-122095?utm_source=outbound_pub_5&utm_campaign=outbound_issue_75125&utm_content=email_mbr_new-york_text-3&utm_medium=email
- (3) https://www.whitehouse.gov/briefing-room/statements-releases/2024/02/29/fact-sheet-biden-harris-administration-announces-new-actions-to-boost-housing-supply-and-lower-housing-costs/
- (4) https://www.cmegroup.com/markets/interest-rates/cme-fedwatch-tool.html
- (5) https://www.bls.gov/news.release/empsit.nr0.htm
- 6) http://www.sca.isr.umich.edu/
- (7) https://www.nasdaq.com/articles/feds-waller-sees-no-crisis-from-commercial-real-estate
- (8) https://www.trepp.com/instantly-access-january-2024-special-servicing-report?utm_campaign=January%202024%20Special%20Servicing%20Report&utm_medium=email&_hsmi=295088401&_hsenc=p2ANqtz-_uIc1FveREq2CivH0eF3reGTDjbpOyBhGBLR7RPStyIGqwliXmHxn9oe4vscwf-2MuG8VlYSi_ZQVsUbXsSZGY9X_BUg&utm_content=295088401&utm_source=hs_email
- (9) https://www.bls.gov/news.release/cpi.nr0.htm
- (10) https://fas.org/publication/exempt-affordable-housing-from-volume-caps/
1. FOMC INTEREST RATE DECISION
- The FOMC left its benchmark federal funds rate unchanged at its January policy meeting as improving inflation and consumer expectations data has reduced the committee’s need to continue its monetary tightening. Still, the timing of potential rate cuts in 2024 remains uncertain as officials grapple with the complexity of domestic and global economic risks.
- As the inflation picture continued to improve to close 2023, markets increasingly forecasted several Fed rate cuts in 2024. By the final trading day in December, fed futures markets assigned a 74% probability for a March rate cut. However, recent statements of caution by Fed officials and increased global economic uncertainty— notably attacks on commercial shipping in the Red Sea—have made futures markets more hawkish. Currently, fed futures markets forecast an 81.5% probability that rates stay unchanged in March.
- Still, dovish sentiment in the market isn’t unfounded. While the unemployment rate has returned to pre-pandemic levels, it has slowly increased over the past 12 months, with layoffs recently appearing to pick up steam. Over the past few weeks, several notable companies, particularly in the tech and media space, have announced significant layoffs. Initial jobless claims have not seen a meaningful uptick, but quits have declined— evidence of a weakening labor market.
- FOMC members will likely move cautiously through their subsequent interest rate decisions as they weigh these developments and digest incoming inflation data.
2. SENIOR LOAN OFFICER OPINION SURVEY
- In January, the Federal Reserve released its quarterly Senior Loan Officer Opinion Survey on Bank Lending Practices (SLOOS), which reflected tighter lending standards and weakening demand across several loan types compared to the previous quarter.
- Respondents reported tightening standards and weaker loan demand to commercial and industrial businesses of all sizes, while the commercial and real estate loan market experienced a similar contraction.
- Residential real estate loans of all categories except governmental residential mortgages and government-sponsored enterprise-eligible mortgages saw standards tighten. Banks also reported weaker demand for home-equity lines of credit, while consumer loans, including credit cards and auto loans, also saw tightening standards alongside weakening demand.
3. MORTGAGE RATES AND APPLICATIONS
- According to data from the Mortgage Bankers Association, the average contract on a 30-year fixed-rate mortgage (on balances $726k or less) rose slightly to 6.8% during the week ending on February 2nd, 2024.
- Rates stand at their highest in four weeks but below the 23-year peak of 7.9% in October.
- Despite the uptick, mortgage applications climbed 3.7% during the same week, following a 7.2% decline the previous week.
- Refinance applications accelerated further, rising by 12.6% following a 1.6% increase during the last week of January. Conversely, new home applications dropped 60 basis points week-over-week following an 11.4% decline during the previous week.
4. 2024 HOUSING MARKET PREDICTIONS
- An article by Forbes advisor noted that while mortgage rates have improved in recent months, home affordability will likely remain a pressing challenge in 2024 as prices remain sticky and housing supply struggles to catch up to demand.
- Many would-be homebuyers were stuck on the sideline in 2023 as borrowing rates surged and existing owners in older, fixed, low-rate mortgages were less inclined to sell at lower prices.
- Experts expect conditions to improve in 2024, forecasting a busier spring home buying season this year compared to last. However, rates are unlikely to return to pre-pandemic levels, which is likely to keep the issue of existing owners “locked in” at lower rates a salient problem for the purchase market.
- According to Jiayi Xu, an economist at Realtor.com, roughly two-thirds of all outstanding residential mortgages have rates below 4%, making it challenging for the housing market to thaw significantly if rates remain north of this range.
- Nonetheless, experts expect that some reduction from today’s 6-7% range will induce higher transaction volume as demand rises, recharging upward pressure on home prices and incentivizing would-be sellers back into the market.
5. HOUSEHOLD DEBT
- According to the Federal Reserve Bank of New York, consumer debt in the US climbed precipitously during the fourth quarter of 2023, rising by $212 billion or 1.2$% from the previous quarter to $17.5 trillion—a new all-time high.
- Mortgage balances rose by $112 billion, followed by credit card balances (+50 billion) and auto loan balances ($12 billion).
- Other balances, including retail cards and other consumer loans, rose by a combined $25 billion, while student loan balances remained relatively unchanged.
- Delinquency rates were higher compared to the third quarter, climbing to 3.1% of all outstanding debt—an uptick of 10 basis points. However, delinquency rates remain below pre-pandemic levels, suggesting that inflation may be causing rising debt levels to appear more severe than reality.
6. JANUARY JOBS REPORT
- According to the Bureau of Labor Statistics, the US economy added 353,000 new jobs in January, while the unemployment rate was unchanged at 3.7%.
- Both metrics point to continued resilience in the labor market amid inflation pressures and interest rate increases, which may further complicate rate-cut considerations in the near term.
- Professional and business services led all sectors with 77,000 job adds, followed by healthcare (+70,000), retail trade (+45,000), and social assistance (+30,000).
- Declines were led by the mining, quarrying, and oil and gas extraction industry (-5,000), which, conversely, saw little net change during 2023.
- Employment changed little in major industries such as construction, wholesale trade, transportation and warehousing, financial activities, leisure and hospitality, and other services.
7. JOB OPENINGS AND LABOR TURNOVER
- According to the Bureau of Labor Statistics, the number of job openings in the United States changed little in December, charting at 9.0 million on the last business day of December.
- Total hires and separations were also little changed at 5.6 million and 5.4 million, respectively. Quits and layoffs saw little movement compared to the previous month, registering 3.4 million and 1.6 million, respectively.
- Job openings increased at a faster rate for establishments with 5,000 or more employees, while those with 1-9 employees and 10 to 49 employees saw little change.
- On a state level, job openings were up in 2 states (Illinois and Colorado) and down in 4 (Mississippi, Florida, Georgia, and Tennessee), while little changed across all other states and the District of Columbia.
8. LOGISTICS MANAGERS INDEX
- The US Logistics Managers Index increased in January to its highest level in three months and, for the first time since September, has seen each sub-metric of its index expand, according to the report.
- The expansion of the index was led by an increase in inventories, particularly activity by retailers who began to restock in January following the holiday season. Resultingly, inventory costs expanded considerably, while transportation costs rose for the first time since June 2022.
- Warehouse activity rose but at a slower pace, with expansion in both warehousing capacity and utilization.
- The report authors note that while January’s uptick is a strong signal, seasonality factors remain at play, requiring additional months of data before concluding that the logistics industry is returning to a period of growth.
9. CONSTRUCTION SPENDING
- According to the US Census Bureau, US construction spending climbed by 0.9% month-over-month in December, in line with November’s revised measurement and exceeding market estimates.
- Over the 12 months ending in December, total construction spending rose by 13.7%, while total construction value in 2023 was 7% above 2022 levels.
- Private construction spending grew by 0.7% in December, primarily driven by a 1.4% increase in residential sector spending, particularly single-family homes. Meanwhile, the non-residential declined by 0.2%. Public spending rose by 1.3% compared to November.
10. UNITED STATES ECONOMIC OPTIMISM INDEX
- According to the Real Clear Markets/TIPP Economic Optimism Index, sentiment fell in February compared to the previous month and registered below the consensus forecast.
- The index segments measuring respondents’ personal financial outlooks and confidence in Federal Economic Policies declined from January. Meanwhile, the index’s six-month economic outlook segment improved compared to last month.
- Investor optimism fell while it gained among non-investors, with investors experiencing a stronger directional movement in sentiment than non-investors.
SUMMARY OF SOURCES
- (1) https://www.federalreserve.gov/newsevents/pressreleases/monetary20240131a.htm
- (2) https://www.federalreserve.gov/data/sloos/sloos-202401.htm
- (3) https://www.mba.org/news-and-research/newsroom/news/2024/02/07/mortgage-applications-increase-in-latest-mba-weekly-survey
- (4)https://www.forbes.com/advisor/mortgages/real-estate/housing-market-predictions/
- (5) https://www.newyorkfed.org/microeconomics/hhdc
- (6) https://www.bls.gov/news.release/empsit.nr0.htm
- (7) https://www.bls.gov/news.release/jltst.nr0.htm
- (8) https://www.the-lmi.com/
- (9) https://www.census.gov/construction/c30/c30index.html
- (10) https://www.realclearmarkets.com/articles/2024/02/06/rcmtipp_economic_optimism_index_weakens_slightly_1009767.html
The SVN Vanguard team can help with your Commercial Real Estate needs. We can help you find the ideal commercial property for sale or lease. Interested in discussing on Buying or Leasing Office Space? Contact us.
1. DECEMBER JOBS REPORT
- US nonfarm payrolls increased by 216,000 in December, above November’s growth of 173,000 jobs and exceeding the consensus estimate of 170,000 according to the Census Bureau’s latest employment report.
- Meanwhile, initial jobless claims fell during the final week of 2023, indicating that the US labor market remains tighter than some projected. Still, claims data in the upcoming weeks will help us understand how much of an impact holiday season hiring is having on current performance.
- Government jobs grew by 52,000 during the month, while the Leisure and hospitality sector continues to lead private employment growth, adding 59,000 jobs in December, followed by Education and Health Services (+42,000), and construction (+24,000)
2. FOMC MEETING MINUTES
- Minutes from the FOMC’s December meeting show that officials have reached consensus that rate-cuts are likely to come in 2024 but refrained from providing a more specific window for them to occur.
- Officials held the federal funds rate steady at 5.25 to 5.50% at their December policy meeting and indicated that they expect three 25 basis-point cuts by the end of 2024 in their most recent economic projections.
- While on average, FOMC members have a sense that the Fed’s tightening cycle has reached its peak, they continue to stress that their actual policy path forward will depend on how the economy continues to evolve.
- Officials noted an “unusually elevated degree of uncertainty” about the upcoming policy path, with some indicating that it may be necessary to keep the benchmark federal funds rate elevated if inflation doesn’t decelerate as expected, while others haft left the door open for additional hikes if conditions call for them.
3. HOMEBUYERS’ MONTHLY PAYMENTS DROP
- The median housing payment in the US is down by roughly $400 (-14%) from its October 2023 peak, enticing some would-be buyers back into the fray, according to a recent analysis by Redfin.
- The decline in payments coincides with a slow but steady drop in the weekly average mortgage rate, which propelled Redfin’s Demand Index up by 10% between November and December.
- New listings also finished 2023 up by 10% over the end of 2022. The report notes that as mortgage rates thaw, homebuying demand should rise as buyers take advantage of more choices alongside better financial conditions. Meanwhile, pending sales dropped by 3% annually to close 2023, its slowest decline in two years.
4. SFR INVESTMENT TRENDS
- According to latest data from Arbor Realty Trust/Chandan Economics, SFR/BTR construction starts reached a new record high in Q2 2023 as cap rates compress, accounting for 7.7% of all single-family starts.
- SFR cap rates fell to 6.1% during Q3 2023, the latest data available, as home prices climbed. Concurrently, SFR rents remained strong.
- SFR occupancy levels averaged 94.4% in Q3, dropping by 10 basis points from the previous quarter. Rent growth has continued to slow, dropping to 4.5% year-over-year through July, the latest data tracked in the report. It was the slowest annual rent growth tracked since April 2020, however, while rent growth has decelerated from its pandemic levels, it currently stands above its 2015-2019 average by a full percentage point.
- Investor purchases of single-family properties continued to decline in 2023, though at a slower pace than the year before, declining by -34.1% in Q2.
5. NON-RESIDENTIAL CONSTRUCTION MOMENTUM
- According to a recent analysis of Census Bureau data by the Associated Builders and Contractors (ABC), a national wave of non-residential construction spending should continue into 2024 despite a downtick in November.
- The analysis showed that non-residential construction spending fell by 0.1% in November due to a drop in public-sector activity, which dropped sharply during the month at a rate of -0.6% month-over-month. Meanwhile, private non-residential spending rose by 0.2% monthly.
- Spending is up by 18.1% over the past year, according to the ABC, while manufacturing-related construction spending continues to surge, according for roughly 45% of the increase in spending over the past 12 months.
6. INFLATION OUTLOOK
- Inflation is expected to continue to fall throughout 2024 driven by the unwinding of supply-chain driven price spikes and falling economic growth, according to a recent analysis by Morningstar.
- The report’s analysts forecast that durable goods will see the greatest drop in inflation or potential deflation as major supply constraints have faded and the global semiconductor market trends towards market surplus. Food and energy price pressures will also likely subside, as the market adjusts to the challenges brought on by the Russia-Ukraine War. Housing price pressures should also reduce as new supply comes online.
- The PCE price index has fallen from a peak of 7% annually in June of 2022 to 2.6% year-over-year through November 2023. Core PCE inflation, the FOMC’s preferred measure, has similarly declined but less steeply.
- The analysts expect average US prices to climb by 1.8% per year between 2024 and 2027, below the Fed’s 2.0% PCE target rate. However, if price pressures continue to exceed 2.0% as the Fed’s tightening cycle unwinds, officials may be ready to induce a recession in 2024 to achieve its goals.
7. CMBS DELINQUENCIES
- CMBS delinquencies fell seven basis points in December, according to recent data by Trepp. Moreover, December’s CMBS activity reverses several months of rising Office delinquencies, with the sector’s rate declining by 26 basis points to 5.82%.
- Annually, the overall CMBS delinquency rate up 147 basis points from the end of 2022 to 4.51% in December 2023, led by the Retail sector with a 6.47% rate. The delinquency rate for Office is a close second at 5.82%.
- Industrial and Lodging were the only sectors tracked that saw a monthly in delinquencies during December, each climbing by 19 bps to 0.57% and 5.40%, respectively. Nonetheless, Industrial delinquencies are negligible compared to the overall market.
8. RETAIL INVENTORIES
- Retail inventories, excluding autos, dropped by 0.8% month-over-month in November, its third consecutive monthly decline, in part reflecting the seasonality factor of relatively high sales activity during the holidays.
- Monthly inventory growth during 2023 reached a high of 3.8% month-over-month during February and as low as -1.1% month-over-month in October. The historical monthly average for retail inventory growth, which has been tracked since 1992, is 0.3%.
- Including autos, annual retail growth charted in at 5.1% during November, reflecting the outsized impact that vehicle sales have on retail inventories. Nonetheless, retail inventories including autos also ticked down on a month-over-month basis, falling -0.1% month-over-month.
9. WHOLESALE INVENTORIES
- US wholesale inventories fell by 0.2% month-over-month through November, its second straight monthly decline, according to Census Bureau data. Besides a flat reading in February and a slight uptick in September, monthly wholesale inventories fell consistently throughout 2023.
- Inventory declines follow a dop in non-durable goods, which dropped -9.6% in November following a 0.9% in October. Meanwhile, inventories of durable goods rose in November by 1.2% following a flat October.
- Inventories fell 3.1% year-over-year through November, with December’s holiday activity likely adding downward pressure to wholesale levels.
10. REDBOOK INDEX
- The Redbook Index, a weekly sales-weighted index of year-over-year same-store sales growth of large US retailers, finished 2023 with a 5.6% increase over the same week in 2022, according to Redbook Research, Inc.
- Between 2005, when the index was created, and the end of 2023, the US Redbook Index has averaged 3.58%. The index’s all-time low was -12.6% reached during the initial pandemic shutdown in May 2020, while its all-time high of 21.9% was reached in November 2021.
- After reaching its November 2021 peak, the US Redbook spent all of 2022 in decline before rebounding in 2023. Index growth is unlikely to return to record growth seen during the pandemic’s economic rebound, but merchandise sales have maintained a healthy level in the face of increased economic uncertainty over the past year
SUMMARY OF SOURCES
- (1) https://www.bls.gov/news.release/empsit.nr0.htm
- (2) https://www.federalreserve.gov/monetarypolicy/fomcminutes20231213.htm\
- (3) https://www.redfin.com/news/housing-market-update-monthly-payments-drop/
- (4) https://arbor.com/research/reports/single-family-rental-investment-trends-report-q4-2023/?utm_content=2023_q4&utm_medium=blog&utm_source=chatter&utm_campaign=chandan_sfr_quarterly_report&utm_term=NA&UTMsource=chatter&rdnaLabel=chandan_sfr_quarterly_report
- (5) https://www.globest.com/2024/01/04/nonresidential-construction-momentum-expected-to-continue/
- (6) https://www.morningstar.com/economy/why-we-expect-inflation-fall-2024
- (7) https://www.trepp.com/trepptalk/cmbs-delinquency-rate-falls-slightly-december-2023-office-rate-posts-rare-dip
- (8) https://www.census.gov/economic-indicators/#adv_mrts
- (9) https://www.census.gov/economic-indicators/#adv_mrts
- (10) https://www.redbookresearch.com/8702.html
Banks hold over half of $6 trillion in commercial real estate loans, with symptoms of stress having appeared, according to the 2023 annual report.
Multiple financial dangers for the United States were identified by the Financial Stability Oversight Council, a remnant of the Dodd-Frank Act that comprises a wide range of federal banking regulators and others, in its 2023 annual report. Commercial real estate comes first on the list.
$6 trillion in loans at the top of the CRE segment as of Q2 2023, half of which are on bank balance sheets because they aren’t sold to government agencies like residential mortgages are. Furthermore, nearly half of all U.S. banks offer the greatest amount of loans in the CRE sector.
No one who has been following the market should be surprised by the concentration, especially considering that “the CRE market faced a rise in vacancy rates and declines in value for some property types, elevated interest rates, heightened CRE loan maturities, inflation in property operating costs, and an increase in CRE loan delinquencies.”
The agency expresses a concern that many in the CRE have voiced. According to the research, high interest rates raise refinancing costs for borrowers and can result in declining property values across CRE sectors. The borrower might not be eligible to refinance the loan at maturity without an additional equity infusion if the property value has significantly declined since the time of financing. As a result, the lender may suffer losses if the loan needs to be restructured or goes into default. Losses from a portfolio of CRE loans may seep into the larger financial system as they accrue.
This may lead banks to liquidate loans and real estate, further depressing values, generating a vicious cycle, and limiting credit availability. Loan distress is already evident; in the second quarter of 2022, the bank default rate increased by 0.74 percent. Delinquencies for CMBS are also higher.
Another worry is that relationships between banks, insurance providers, real estate investment trusts, and private lenders could allow bank stress to spread.
“Supervisors, financial institutions, and investors continue to closely monitor CRE exposures and concentrations and to track market conditions,” according to several recommendations made by the FSOC.
“Resilience to potential stress, ensuring adequate credit loss allowances, assessing CRE underwriting standards, and reviewing contingency planning for a possibly protracted period of rising loan delinquencies” are some of the recommendations for continuous assessment of loan portfolios.
The SVN Vanguard team knows investors need an experienced commercial property management company by their side. Contact us for multifamily properties for sale.
Delinquency rates for lenders with the strictest underwriting guidelines are somewhat higher.
The most recent Commercial Delinquency Report from the Mortgage Bankers Association shows that, for the third consecutive month, there was an unanticipated increase in commercial mortgage delinquencies in the third quarter of 2023.
In prepared remarks, Jamie Woodwell, MBA’s Head of Commercial Real Estate Research, stated that rising interest rates, shifts in certain aspects of the real estate market, and uncertainty around property valuations were the main causes of an increase in delinquency rates across all major capital sources.
According to Woodwell, “CRE market activity remains muted, further complicating the situation.”
Mortgage performance varies significantly depending on the type of property, according to data from the MBA survey that was made public earlier this quarter.
According to Woodwell, a wide range of factors, including deal vintage, term, and market conditions, also influence which loans are under pressure. These distinctions are probably going to stay significant in the upcoming year.
Delinquency rates for banks and thrifts (90 days or more past due or non-accrual) based on the unpaid principal balance (UPB) of loans are 0.85% in Q3, up 0.18 percentage points from Q2 2023.
With 60 days or more past due, the life company portfolios had rates of 0.32 percent, up 0.18 percentage points from Q2 2023.
The rate for Fannie Mae loans (60 days or more past due) was 0.54 percent, up 0.17 percentage points from Q2 2023.
Loans from Freddie Mac that were 60 days or more past due had a 0.24 percent default rate, up 0.03 percentage points from Q2 2023.
The percentage of CMBS loans in REO or 30 days or more past due was 4.26 percent, up 0.44 percentage points from Q2 2023.
According to Selina I. Parelskin, CEO and founder of Beacon Default Management, the research presents a dire image of the status of the CRE capital markets, but the situation may well be considerably worse. She informs GlobeSt.com that while these figures include loans for building and development, private lenders and debt funds are not included in this list.
“A few of these have lent many tens of billions of dollars on high-leverage multifamily syndicated loans, where the sponsor has a very small amount at risk compared to their investors and lenders,” the spokesperson stated. “Some of these use their own bank lines.”
The debt fund will not be paid back in full, the investors and borrowers have lost all of their equity, and the underlying warehouse or credit facility will suffer a loss. A large number of these funds are expected to experience loan losses.
According to Parelskin, almost 25% of the loans held by these funds are either matured or in default.
According to her, the majority of debt funds ignored inflation worries and believed that interest rates and cap rates would remain at historically low levels. Up to 80% loan to cost and the equivalent of 3.25% cap rates on in-place income were required at the time of going into underwriting.
According to Parelskin, a lot of bankers are working hard to adjust their problematic debt.
However, based on our discussions, we anticipate a notable increase in commercial mortgage delinquency rates by the end of Q1 2024, as the spokesperson stated.
Vice President of MetroGroup Realty Finance, Ivan Kustic, tells GlobeSt.com that the MBA data supports the originators and suppliers of these mortgages that his company is experiencing.
Banks and thrifts are generally on the lower end of the recourse spectrum, while Fannie and Freddie are on the lower end due to their reputation as highly performing multifamily assets, Kustic stated.
According to him, life insurance businesses that practice conservative underwriting and have lower loan-to-value ratios often have fewer delinquencies.
According to Kustic, the CMBS has a rate of 4.26%, which is significantly higher than the other four lending groupings. It also has more aggressive loan values and more liberal underwriting.
Thus, he explained, the lenders with the most aggressive underwriting standards will see slightly higher delinquencies than the other four lending groups when we see stress in the real estate market.
The SVN Vanguard team knows investors need an experienced commercial property management company by their side. Contact us for multifamily properties for sale.
1. INFLATION AND FALLING ENERGY PRICES
- The latest PCE price index rose in line with consensus expectations in October, but the divergence between the core and headline numbers reflects the disinflationary impact of falling energy prices in recent months.
- According to the Bureau of Economic Analysis, the core inflation rate, which excludes food and energy costs from calculations and is the Federal Reserve’s preferred measure for monetary policymaking, climbed 0.2% month-over-month and 3.5% over the past 12 months. However, headline inflation (including food and energy) remained flat for the month.
- Falling energy prices largely explain the static headline numbers even as core prices climb. In October, energy prices fell a massive 2.6% month-over-month, significantly dampening the inflationary impact of other goods, such as food and housing, that gained during the month.
- As the Fed’s preferred measure rises while the more publicly visible headline data flattens, it compilates its short-term interest rate policy decisions. However, officials will likely be looking to see if falling energy prices dampen prices of core consumer goods and whether falling headline inflation helps shift future inflation expectations.
2. MORTGAGE RATES FALL
- The average rate on a 30-year fixed rate mortgage fell for the sixth consecutive week during the week of December 7th, charting at 7.03%, according to Freddie Mac data.
- The latest reading reflects a notable decline in Treasury yields that began toward the end of October as bond markets recalibrated for an increased likelihood of the Fed ending its interest rate tightening.
- Rates continue to sit close to multi-decade highs but have fallen off of a rent peak of 7.8% reached in late October. According to Freddie Mac’s Chief Economist, while purchase activity initially increased in response to falling rates in early November, this improvement in demand has receded in the past week.
3. 2024 NATIONAL HOUSING MARKET OUTLOOK
- According to Bright MLS’s 2024 National Housing Market Outlook, market watchers should expect a fall in mortgage rates next year that could lead to an uptick in home sales, while prices will likely remain relatively stable.
- The report’s authors project that mortgage rates, which reached north of 7.0% in 2023, will settle between 6.0% and 6.5% in 2024 as the Federal Reserve appears poised to pause or loosen its interest rate policy in the near term.
- Many economists have noted resilient housing demand in 2023, but a financing environment that has dampened transaction volume as would-be buyers and sellers wait for each other to blink. According to the forecast, a downward shift in mortgage rates should also loosen pent-up demand for homeownership, resulting in higher home sales volume.
- Home prices are projected to remain stable in 2024 as several factors push and pull on market prices. Median home prices grew by roughly 13.7% annually between 2019 and 2022. Such growth rates are high by historical standards, so while increased activity next year may reinvigorate price growth, a continued higher-rate environment will likely moderate the housing market’s growth ceiling.
4. CONSUMER CONFIDENCE
- Consumer confidence rose in November following three consecutive monthly declines, according to the latest data from the Conference Board.
- The increase was led by a rise in future optimism, as the expectations sub-index of the report, which measures the short-term outlook for income, business, and labor market conditions, rose during the month. The present situation index, where consumers assess current business and labor conditions, fell slightly.
- Despite the increase in the expectations index, the measure remains in the recessionary range, according to the report’s analysis. Consumer recession fears have recently abated to their lowest levels of the year. However, roughly two-thirds of consumers still perceive a risk of recession over the next 12 months.
5. FED BEIGE BOOK
- Economic activity has slowed in the past several weeks, according to the Federal Reserve’s latest Beige Book, which summarizes recent anecdotal sentiments about US economic conditions.Four of the twelve Fed districts reported modest growth, two districts indicated flat conditions, while the six others cited overall declines.
- Retail and auto sales were reported as mixed across the country, while sales of discretionary items and durable goods declined as consumers expressed more price sensitivity in their spending decisions.
- According to respondents, travel and tourism activity remained robust, but demand for transportation services was sluggish overall.
- In other areas, manufacturing activity was mixed, demand for business loans declined, and consumer credit conditions remained healthy, according to servicers—despite an uptick in delinquencies.
- Commercial real estate activity continued to slow. Moreover, several districts reported a slight decrease in residential sales and inventory.
6. CONSTRUCTION SPENDING
- Construction spending rose by 0.6% between September and October, according to the latest readings from the US Census Bureau, roughly in line with economists’ expectations.
- Private construction increased by 0.7% in October, primarily driven by a 1.3% rise in residential spending, specifically in the single-family segment. Multifamily construction decreased slightly during the month, declining by 0.1%.
- Non-residential construction rose by 0.1% in October. Meanwhile, spending on manufacturing projects fell by 0.4%, but factory construction continues to climb, partly reflecting the market effects of the White House’s push to on-shore semiconductor manufacturing. Public construction spending rose by 0.2% in October.
7. JOB OPENINGS AND LABOR TURNOVER
- US job openings fell 6.6% month-over-month in October, according to the latest Job Openings and Labor Turnover Survey from the Labor Department.
- Current job openings stand at 8.73 million nationwide, the lowest total for the US since March 2021. The current ratio of job openings to available workers declined between September and October from 1.3 to 1.0.
- The consensus forecast by economists leading up to the report was 9.4 million, well above the actual readings. Fed officials watch the report closely for signs of labor market slack or tightness, and the falling ratio between openings and workers may signal that the labor market is shifting towards a higher slack environment.
8. SINGLE-TENANT LEASE SUPPLY RISES
- Inventory in the single-tenant net lease (STNL) market jumped in Q3, according to recent Globe Street reporting of brokerage data. Properties on the market increased by nearly 19% quarter-over-quarter.
- While new supply could help dull inflationary pressures from consumer goods, newer properties are arriving at roughly double the rate of older stock falling off the market, limiting price growth.
- According to the analysis, the most significant contributor to the surge was big-box properties, which saw a 144% increase in retail space during the quarter.
- Distribution facility supply also rose, climbing by 19% between Q2 and Q3, partly reflecting the increased use of sale-leaseback within the industrial sector.
9. CRE LOAN COLLATERAL
- According to an analysis by MSCI Real Capital Analytics, the price of loan collateral has seen a significant drop-off over the past year; however, most loans remain above their origination value, dampening the effect of the market correction.
- 81.5% of loan collateral has experienced a price decline in the past 12 months, but only 40% have values below their origination amount.
- Still, roughly half have experienced price corrections that have pushed loan-to-value (LTV) ratios into a “danger zone” that could limit refinancing capabilities. Of those in the “danger zone,” 58% face loan maturities within the next five years, while 37% face maturity within three years. The recent activity signals that market risk could lessen as the macroeconomic environment evolves in the near future, but that current levels warrant increased attention to market activity.
10. PENDING HOME SALES FALL
- Pending home sales, a useful leading indicator for future housing demand, fell by -1.5% in October, according to the National Association of Realtors.
- Declining activity was concentrated in the US’s West, Midwest, and South regions. In contrast, the Northeast region saw an uptick. Transactions fell in all four regions on an annual basis.
- The West region experienced the steepest monthly decline, with activity falling a drastic 6.0% between September and October. The South region fell by 1.9% month-over-month, while the Midwest fell by a more modest 0.4%. The Northeast region climbed by 2.7% on the month.
- Notably, this year’s continued slowing activity has produced new lows for the index, which originated in 2001. This reflects the impact of generationally high mortgage rates, which continues to dampen prospective homebuying.
SUMMARY OF SOURCES
- (1) https://www.bea.gov/news/2023/personal-income-and-outlays-october-2023
- (2) https://freddiemac.gcs-web.com/news-releases/news-release-details/nearing-seven-percent-mortgage-rates-continue-decrease?_gl=1*17est5i*_gcl_au*NDQ4MzU4NzA0LjE3MDE5Njk2MjM.&_ga=2.112390148.1813790579.1701969623-1128088453.1701969623
- (3) https://www.brightmls.com/article/2024-national-housing-market-outlook
- (4) https://www.conference-board.org/topics/consumer-confidence
- (5) https://www.federalreserve.gov/monetarypolicy/beigebook202311.htm
- (6) https://www.census.gov/construction/c30/c30index.html
- (7) https://www.bls.gov/news.release/jolts.nr0.htm
- (8) https://www.globest.com/2023/12/07/single-tenant-supply-sees-a-big-jump-in-q3/
- (9) https://www.msci.com/www/blog-posts/assessing-the-health-of-us-real/04177027314 utm_source=pardot&utm_medium=email&utm_campaign=real-estate-newsletter-11-29
- (10) https://www.nar.realtor/newsroom/pending-home-sales-fell-1-5-in-october
With seasonal slowdowns, rents are probably going to stay low for another month or two.
November is the fourth month in which the national median rent for multifamily buildings has declined, falling 0.9% month over month to $1,340, according to Apartment List. Because of the low demand over the holidays, rent growth is probably going to keep going downhill for another month or two.
Growth from the previous year was -1.1%. Apartment List stated that the current situation “stands in stark contrast to the prevailing conditions of 2021 and 2022 when rent prices were surging and year-over-year growth peaked at 18% nationally.” However, the national median rent is still roughly $250 per month higher than it was just three years ago, even with this cooling off.
6.4% is the national vacancy rate, which is a little higher than it was before the pandemic. Given the number of apartment buildings that are continuously being constructed, it is unlikely that this will change anytime soon. On the other hand, local markets, not national ones, determine construction levels. As previously predicted by GlobeSt.com, there will be a great deal of fluctuation in the upcoming year, with certain metro areas experiencing severe gluts.
According to the business, rents decreased regionally in 89 of the 100 largest cities in the country in October, and prices are declining year over year in 68 of these 100 cities. “The California markets like Oakland, San Francisco, and Long Beach, where apartment demand remains sluggish, are concentrated in the sharpest rent declines over the past year.”
Rewinding to November of 2017, that drop was the second biggest Apartment List had ever experienced. They stated, The only other time November brought a greater decline was the previous year when rents dropped by 1.1 percent as the market entered the still-present period of sluggishness. In contrast, November declines averaged 0.5 percent from 2017 to 2020.
The Midwest and Northeastern markets are experiencing the fastest rent growth. Providence (4%), Milwaukee (4%), Louisville (4%), Chicago (3%), Oklahoma City (3%), Hartford (3%), Boston (3%), New York (3%), Washington, D.C. (2%), and Indianapolis (2%) have had the highest rent increases during the previous 12 months.
Austin(-6%), Portland, Ore.(-5%), San Francisco(-4%), Phoenix(-4%), Atlanta(-4%), Orlando(-4%), Raleigh(-4%), Jacksonville(-4%), San Antonio(-3%), and Salt Lake City(-3%) had the smallest rate of increase in rent.
The rate of vacancy has recovered to levels higher than before the outbreak. They stated, Changes in the balance between the number of vacant apartments available and the number of renters looking to move into them are largely responsible for the price fluctuations that have rocked the rental market over the past three years.
The SVN Vanguard team knows investors need an experienced multifamily property management company by their side. Contact us for multifamily properties for lease and for sale.
While certain metro areas that had significant demand during the epidemic now exhibit weakness, others that were hardest hit during the pandemic now show strength.
Data is beginning to indicate that there may be greater pressure on the multifamily segment than many people expected. Based on September’s CMBS payment rates, Moody’s Analytics CRE recently raised the topic of whether multifamily was anything to be concerned about.
In their research of other property types, they were “quite surprised to see a particularly poor September showing for Multifamily.” “The payout rate for multifamily has been exceptionally high throughout the year. Only February (82.8%) and April (92.8%) had payout rates less than 95% before September. The September figure was an astounding 71.7%. This was particularly unexpected considering that three of the year’s top four payoff months had just ended.
Trepp now takes a different tack when explaining how multifamily may have become a threat to regional banks in addition to office.
Research analyst Emily Yue for the company stated, “Trepp estimates that $351.8 billion in multifamily bank loans will mature between 2023 and 2027 based on the Fed Flow of Funds data.” In this analysis, Trepp looks at trends in criticized loans in the multifamily markets in the United States. It takes into account the effect of recent developments on the growth of rental income as well as elements like higher interest rates, more stringent bank regulations, and tighter liquidity, all of which have limited refinancing options.
Trepp ranked the default risks of metropolitan statistical regions (MSAs) based on the greatest outstanding balances of multifamily loans. The ratings range from 1 to 9, where 1 represents the lowest risk and 6 or more is considered a “criticized loan.”
The percentage of multifamily loans that have been criticized varies significantly among U.S. geographies; some areas that have weathered the pandemic well are beginning to show signs of weakness on the periphery, while other areas that were severely affected by the pandemic are beginning to recover, Yue stated. From Q4 2021 to Q2 2023, the percentage of criticized multifamily loans decreased in three multifamily markets while it increased in the remaining ones. While some of these metros have seen spikes or declines in the rate, most have seen a delinquency rate that has remained close to 0.0%.
In a dramatic turn of events, some of the metro areas most severely damaged by the pandemic are now exhibiting strength, while others with robust rental demand are displaying weakness. Furthermore, over thirty percent of multifamily debt is held by banks.
In Q2 of 2021, New York had a 31.0% loan criticism rate. The biggest decline of all was shown in the percentage by the same period in 2023, which was 16.3%. However, as the delinquency rate increased from 0.9% at the end of 2021 to 1.9% in Q2 of 2023, this does not by itself provide assurance of safety.
The Phoenix area, a hot market during the epidemic, is an illustration of the second dynamic. In contrast to 2021 and 2022, asking rents have been declining in the first half of 2023. At midyear, the overall percentage of vacancies was 9.3%, whereas the national average was roughly 6%. Although there is currently no delinquency, “the increase in the criticized loan share is indicating perceived risk coming down the line for these loans due to oversupply and looming concerns of a recession.”
The SVN Vanguard team knows investors need an experienced commercial property management company by their side. Contact us for multifamily properties for sale.
1. WEWORK BANKRUPTCY, CRE IMPACT
- On November 6th, co-working trailblazer WeWork filed for Chapter 11 bankruptcy, bringing additional unease to an office sector battered from the residual effects of the remote-work revolution.
- Over the previous decade, including before the pandemic, many office landlords around the world looked to the co-working giant as the future of office life, with leasing to the firm proliferating across many global economic hubs. However, as those bets soured in recent years, owners have increasingly turned to debt financing to stay afloat, raising concerns that a reduction of leased space by WeWork could place a wave of distress on a sector already facing high vacancy rates.
- There are also concerns about the ripple effect of the bankruptcy on small and mid-sized banks, which are disproportionally exposed to commercial property debt on their balance sheets. Still, US banks remained highly liquid, limiting the risk of the CRE exposure to the broader financial system.
- Notably, many WeWork leases are in Class B buildings, which predictably have had a tougher challenge with occupancy compared to Class A buildings during the current downturn. This may increase the challenge that landlords will face in filling new vacancies. So far, WeWork has filed to terminate nearly 70 leases worldwide.
2. COMMERCIAL PROPERTY PRICES
- According to the MSCI RCA Commercial Property Price Index (CPPI), all US commercial sectors posted annual price declines in September, matching August’s -9.0% year-over-year drop. However, average prices were flat month-over-month, potentially signaling that we are close to the cyclical nadir for commercial prices.
- The apartment sector posted the most significant year-over-year decline in CRE for the second straight month, but declines in the sector have eased in the third quarter compared to earlier this year. Apartment prices fell by -0.3% month-over-month and -12.8% year-over-year in September.
- The industrial sector, which has been the best-performing CRE sector during both the pandemic-era boom and the current market downturn, fell -0.8% annually but climbed 0.2% month-over-month from August. The directional shift of the sector in September may serve as another signal that commercial prices are reaching their floor.
- Retail prices were down -0.1% from August and -6.9% year-over-year. Meanwhile, suburban offices fell -0.3% from August and -9.0% annually. CBD office prices were unchanged monthly but declined -5.6% year-over-year.
3. CRE MARKET INSIGHTS, OCTOBER 2023
- The National Association of Realtors’ (NAR) monthly report on CRE insights notes that the commercial real estate market continues to experience rising vacancies and slowing rent growth in October but that labor market fundamentals and seasonal factors represent tailwinds that are keeping the sector stable.
- NAR notes that the multifamily segment has seen resurging demand in 2023 as mortgage rates mount, dampening homebuying activity. Net absorption in the sector has risen by 33% over the last 12 months, while construction unit deliveries are up 17% from last year.
- Rent prices in the industrial sector continue to expand and remain above pre-pandemic levels despite a recent deceleration in rent growth. Vacancy rates have moderated back towards pre-pandemic levels; however, this is primarily due to a 43% increase in square footage delivered over the past year.
- Retail sector vacancies now sit at a 10-year low of 4.1% as of September. Rent growth has eased but remains above pre-pandemic levels. Further, consumer spending remains strong despite higher goods prices, keeping the sector on solid footing.
4. INTEREST RATE DECISION
- At its November 1st policy meeting, FOMC officials held interest rates unchanged at their target rate of 5.25% to 5.5%. The Fed has now held rates unchanged for two consecutive months, a first throughout its current tightening cycle that began in March 2022.
- While acknowledging the favorable trajectory of US inflation pressures, Fed Chair Jerome Powell refrained from claiming victory, indicating that the economy remains above the central bank target of a 2% longterm average.
- Powell also cited the resiliency of the US economy, stating that taming inflation will likely require a slowdown in the labor market and economic growth. Real US GDP grew by 4.9% in the third quarter, its fastest pace of growth in nearly two years.
- Several Fed watchers and experts foresee the Fed holding rates at current levels well into next year, citing the economy’s ability to grow at current borrowing rates as a hedge against the downside risks of keeping rates higher for longer. Meanwhile, elevated inflation expectations suggest that rate cuts would be too risky of a move for policymakers to make in the short term as they attempt to re-anchor inflation expectations towards their 2% target.
5. FINANCIAL STABILITY RISKS
- The October release of the Federal Reserve’s semi-annual Financial Stability Report notes that several aspects of the US economy remain on solid footing, including leverage in the financial system, funding risks, and borrowing by businesses and households. However, strains in the CRE industry, persistent inflation, and geopolitical risks are the most significant near-term risks to the financial system.
- Despite the rise in debt servicing costs, the report notes that debt-to-GDP ratios among households and businesses remain close to historical averages.
- Price-to-earnings ratios among equities are elevated, but bond market risk premiums remain near the middle of their historical distribution, signaling low risk.
- Still, risks are rising in other areas. The Fed notes that a significant slowdown in US economic growth could dampen profits in non-financial businesses, including real estate. High leverage levels in these sectors could expose them to stress and defaults in a recession scenario.
- Geopolitical risks to global markets have increased. Russia’s ongoing war against Ukraine continues to impact energy and agriculture markets, and more recently, Hamas’ attack on Israel and the ensuing response risks spilling over into a broader Middle East conflict and could lead to adverse effects on global markets.
- The banking system remains sound, according to the report, despite vulnerabilities exposed during the bank failures in the spring 2023. Most US banks remain highly liquid with capital ratios close to previous decade averages.
6. OCTOBER JOBS REPORT
- According to the Bureau of Labor Statistics, the US economy added 150,000 new jobs in October, the smallest monthly growth total since June. The unemployment rate ticked up marginally to 3.9%.
- Last month’s growth came in under the consensus forecast of 170,000 and is a sharp decline from a strong showing in September when firms added nearly 300,000 new payrolls.
- The Health Care (+58,000), Government (+51,000), and Construction (+23,000) sectors led all occupations in gains, while manufacturing posted a decline, in part due to the persistence of auto strikes during the month.
- Average hourly earnings increased by 0.2% month-over-month and 4.1% year-over-year in October. Annual wage growth has charted above inflation in consecutive months since May, giving workers a boost in real wages. Upcoming CPI data will confirm whether real wages have continued to grow in October.
7. DECLINE IN APARTMENT STARTS EXPECTED
- A recent survey conducted by John Burns Real Estate Consulting suggests that apartment developers expect starts to decline further over the next 12 months following a 40% decline in starts so far in 2023.
- The survey points to increasing debt cost challenges for developers, as construction pricing remains relatively unchanged from previous years, but higher interest rates raise project costs. According to the survey, developers would need a 10-20% decline in construction costs to offset higher debt financing costs.
- Analyzing the report, Real Page SVP and Chief Economist Jay Parsons notes that the industry has recently enjoyed a generational high in apartment starts. Still, this phase is coming to a close as borrowing costs settle at new highs and price gains slow as supply catches up to demand.
8. LOGISTICS MANAGERS INDEX
- The Logistics Manager’s Index, a composite score that denotes expanding or contracting activity in the warehousing and transportation sector and a key proxy indicator for Industrial property activity, posted a third consecutive increase in September. It is the most robust performance for the sector since January.
- Warehousing prices slowed in September but continued to climb, while both warehouse and transportation capacity fell, signaling increased activity and demand relative to supply.
- Transportation prices fell but at their slowest rate since September 2022.
- Inventory levels have recently moved back into expansion after five consecutive months of contraction.
- It is to be seen whether the recent expansion is due to seasonal factors or a sign that the economy is picking back up again. Notably, month-ahead expectations by survey respondents in September were at their strongest in 2023.
9. MANUFACTURING PURCHASING MANAGERS’ INDEX (PMI)
- The US ISM Manufacturing Purchasing Managers’ Index (PMI) dropped in October from a 10-month high in September, indicating further contraction in the US manufacturing sector.
- The contraction in new orders accelerated from the previous month and charted its 14th straight monthly decline. Survey respondents noted lower demand from both domestic and foreign markets.
- Production also slowed, with a sharp decline in the backlog of orders, partially offsetting a decline in demand for new products.
- Sector employment also contracted following an increase in September, while input prices fell for the sixth consecutive month.
10. US PERSONAL SPENDING
- According to the Bureau of Economic Analysis, personal spending in the United States rose by 0.7% month-over-month in September, an increase from August and beating market expectations of a 0.5% growth rate.
- Spending on services rose sharply, increasing by $96.2 billion or 0.8% month-over-month. Within services, international travel, housing and utility services, healthcare, and air travel saw the most significant increases.
- Spending on goods also rose during the month, climbing by $42.5 billion, or 0.7% month-over-month. In the goods category, prescription drugs, motor vehicles, and parts contributed the most to September’s growth.
SUMMARY OF SOURCES
- (1) https://www.bloomberg.com/news/articles/2023-11-07/wework-s-collapse-is-latest-blow-to-newyork-san-francisco-office-markets
- (2) https://info.msci.com/l/36252/2023-10-18/xzzn44/36252/1697663732SmMj3Ch7/2310_RCACPPI_US.pdf
- (3) https://www.nar.realtor/commercial-real-estate-market-insights/october-2023-commercial-realestate-market-insights
- (4) https://www.federalreserve.gov/newsevents/pressreleases/monetary20231101a.htm
- (5) https://www.federalreserve.gov/publications/2023-october-financial-stability-report-overview.htm
- (6) https://www.bls.gov/news.release/empsit.nr0.htm
- (7) https://yieldpro.com/2023/11/developers-expect-further-decline-in-apartmentstarts/#:~:text=Apartment%20developers%20expect%20a%20further,Investor%20Survey%20dated%20October%2030.
- (8) https://www.the-lmi.com/
- (9) https://www.ismworld.org/
- (10) https://www.bea.gov/news/2023/personal-income-and-outlays-september-2023
