Experts say the cost of financing will keep rising to unprecedented levels.
The benchmark interest rate set by the Federal Reserve has increased by 75 basis points for a second consecutive month. The goal range for overnight interbank lending is 2.25 percent to 2.5 percent, and as it rises, so do many other interest rates, including those that commercial real estate companies will have to pay to get credit.
According to Kevin Fagan, head of CRE economic analysis at Moody’s Analytics, “The Fed announcement of hiking their target Fed funds rate by 75 basis points was highly expected.” The majority of market participants in commercial real estate are likely to have anticipated this, especially lenders as they have seen loan interest rates climb by more than 50 basis points in 2022, primarily in the second quarter. As a result, asset values are under pressure, and lender profits and borrower returns are constrained. Therefore, [as the industry evaluates the near-term future], [we predict] both loan issuance and commercial real estate sales volume to decline in Q2.
The Federal Open Market Committee of the Federal Reserve, which is tasked with containing both inflation and unemployment, justified its actions by highlighting recent steady job growth, high inflation, widespread pricing pressures, and Russia’s ongoing invasion of Ukraine.
Stephen Bittel, founder and chairman of Terranova Corporation, says there is a clear gap between expectations of buyers and sellers in our current investment climate. “..sellers seek the price attainable last year, while buyers expect a discount because of a higher cost of debt capital,” says Bittel. He adds, “Development deals that were already contending with higher construction costs are now also hurt by a higher cost of debt, coupled with an expectation of a higher equity yield.”
Commercial real estate is already feeling the effects. According to Adil Hasan, director of real estate at Yieldstreet, “The CRE market has seen a significant slowdown in transaction volume over the last couple months and the trend is expected to continue until there are signs of stability from the Fed.” Hasan notes that, “The inability of CRE investors to determine market value of assets primarily due to uncertainty around debt capital markets will keep many investors on the sidelines.” He also argues that the, “…rising cost of debt will hurt cash flow for properties that have floating rate debt, forcing many property owners to be forced sellers.”
Investors who made real estate purchases three years ago and are trying to roll over financing are getting one-year extensions from their lenders, according to Bill Doyle, co-founder and managing director at Equity Oak Ventures. Due to a significant decrease in appraiser valuation, he says, “All forms of lenders, especially debt funds, are in need to rebalance those notes.” The continuing rate increases only put more pressure on the need to rebalance mortgages. Experts note that in the debt market, the next 90-120 days will determine whether existing mortgages will need to be extended, refinanced,or ultimately handed back to lenders.
Some, however, do stand to benefit from the current state of the lending market. Hasan points out that, “This could present some attractive acquisition opportunities for investors that have the capital available.”
The SVN Vanguard team knows investors need an experienced commercial property management company by their side. Contact us for multifamily, industrial, office, retail, and general commercial properties for sale.
These programs, which are provided by schools, universities, and business associations, are influencing the subsequent generation of CRE leaders.
People wishing to expand their skill sets within the commercial real estate market can now access a wide range of resources. Although they were not as common in the past, commercial real estate-specific degrees and certifications have become more and more popular in recent years. Young professionals with formal educations in commercial real estate are now more prevalent in the labor market.
According to Thomas Sherlock, a principal at Talonvest Capital, “Having a formal education in commercial real estate is an opportunity and advantage for anyone interested in a CRE career, For many individuals, that formal education provides the opportunity to start a career with a greater understanding of important fundamental factors in a variety of the industry’s interconnected specialties.”
While working in the industry, many seasoned experts are obtaining qualifications in commercial real estate.
At the Marshall Bennett Institute of Real Estate at Roosevelt University, Catherine Hughey is pursuing a Master of Science in Real Estate while also enrolling in two in-person evening courses. She also serves as general manager for JLL at the modern, 473,000 square foot 800 Fulton office skyscraper in Chicago’s Fulton Market. Hughey, a lifelong learner who graduated from Project REAP – Chicago in 2018, holds real estate broker licenses in Wisconsin and Illinois. She participates in both the BOMA/Chicago Diversity and Inclusion Committee and the JLL Midwest PM Diversity and Inclusion Committee.
Hughey declared, “You can’t lose. The Marshall Bennett Institute of Real Estate gives you all the tools you need to win, and all the instructors make the classes interesting.”
There are numerous reputable programs given by colleges, universities, and organizations that offer classes, real-life experience, practical knowledge, problem solving, group projects, and internship opportunities to match the career objectives of persons like Hughey. not to mention the intangible advantages like networking and mentoring. For instance, Chloe Asnes, a member of the George Washington University School of Business’s 2022 graduating class, says that the school’s real estate undergraduate concentration has a sizable and vibrant student body. “We are very fortunate to have engaged alumni who mentor students, help us expand our networks and provide us with technical training and interview prep,” according to the speaker.
These programs prepare the next generation of business executives for the opportunities and difficulties presented by commercial real estate by awarding a variety of degrees and certificates. The Advanced Management Development Program in Real Estate at Harvard University Graduate School of Design is where Sinobo Group’s director of asset management, Angela Han, is enrolled. She claims that the training is quite useful and covers a variety of topics in addition to only the high-level technology in buildings.“The program introduced the different standards that buildings can seek, LEED, WELL, etc., but also gave insight into the cost/benefit of which of these to pursue depending on the project you are working on. It also discussed the technological and practical overlap of different standards—some have more similarity, while others are very different. And the group discussion challenged us to think about the pros and cons of the different standards for our different projects.
For students who may not desire to pursue a university degree, there are other options. For instance, the CCIM designation is a demanding program of advanced study and training in financial and market analysis offered by the CCIM Institute. Students who want to receive the designation must enroll in classes, present a portfolio of relevant experience for review by a special committee, and pass a one-day exam. According to Karl Landreneau, a senior instructor at the CCIM Institute, “one of the biggest advantages of a CCIM Institute education is that all courses are taught by instructors who are CRE practitioners. The instructors are certified and trained, required to attend two adult education courses annually, and are also graded by their students.”
Another illustration is Project REAP, a diversity initiative for the commercial real estate sector that also provides an 8–10 week continuing education course on the fundamentals of real estate asset classes and its different functional disciplines, such as finance, leasing, property management, investment, brokerage, and development.
We are ready to assist investors. For questions about Commercial Real Estate for rent and Commercial Real Estate Listings, contact your Los Angeles commercial real estate advisors at SVN Vanguard.
Multifamily rent increases cost landlords.
Since the pandemic threw the status quo on its head and rattled it, multifamily has been one of the gleaming aspects of commercial real estate, along with industrial. Rent growth’s capacity to continue justifies lower cap rates and contributes to price increases.
But nothing can remain in one place for ever. The ordinary person still has a salary that trails inflation despite a strong employment market, according to research on multifamily rents. Additionally, when consumers pay more, they frequently expect something worthwhile in return.
The “2022 State of Resident Experience Management Report” from Zego came to that conclusion. The analysis stated that, “Renters are going to see increases for the foreseeable future, albeit, not at such drastic rates,”. According to projections made by the National Apartment Association, annual rent growth will continue to increase through 2022, albeit at a moderate rate of 6.3 percent to 7.0 percent.
Although the industry may use the phrase “moderate,” consumers are unlikely to. The rule of 70, a quick calculation for the time required to double a value accomplished by multiplying the percentage rate of increase into 70, makes the amount even bigger than it might appear. Given all other factors being equal and a 7 percent annual growth, someone renting an apartment for $1,500 a month would end up spending $3,000 in 2032.
The turnover cost is at what is probably a record level when people leave, such as when they relocate to a place that is more inexpensive for them or that they believe offers a value that is more in line with what they pay. Zego estimated that, compared to $3,850 in 2021, the average cost of promotion and marketing, unit maintenance, concessions, and missed rent will be $3,976.
It would take 17.6 months to repay the turnover costs if you increased the $1,500 unit’s rent by $225, or 15%. And as Zego pointed out, according to a Zumper poll, 81.6% of respondents planned to relocate in the following 12 months.
This leads to a vicious cycle. Customers demand even more with increased pricing and are more likely to leave if they don’t get what they want. People move, turnover costs are high, owners and management increase rents to try to cover the expense within a reasonable amount of time. Their online reviews also have an impact on future visitors to a location.
According to Zego, “modern living features” are the main factor in renters renewing their leases, while a lack of such elements is the main cause of their eviction. “Renters always want the best value for their money, particularly now when rent prices are at their peak. New and modern is not only attractive, but it signals that companies prioritize updating the community.” Which means investing in community façade, unit features, and building technology. The other choice is to spend money on turnovers.
The SVN Vanguard team knows investors need an experienced commercial property management company by their side. Contact us for multifamily, industrial, office, retail, and general commercial properties for sale.
Alternative assets are finally caught up by stock and bond repricings.
The fundamental tenet of Newtonian physics is that anything that ascends will eventually descend under the force of gravity unless it is caught by a soaring eagle. The Green Street Commercial Property Price Index indicates that, overall, this is what occurred to commercial real estate property prices in the second quarter of 2022.
The index, which is defined as a “time series of unleveraged U.S. commercial property values that captures the prices at which commercial real estate deals are currently being negotiated and contracted,” fell by 3.7 percent between May and June. 4.9 percent of the value has been lost overall from the peak point in March.
Overall, that is a 10% increase over the previous 12 months and a 10% increase since pre-covid periods.
Peter Rothemund, co-head of strategic research at Green Street, stated in prepared remarks that “the repricing that has occurred in bonds and stocks is finally evident in the commercial property market.Price discovery is still taking place, and economic uncertainty and interest rate volatility make that challenging, but prices of most properties are down 5%+ from recent highs. In a few sectors, pricing has held up better.”
By property type, performance varies considerably. Strip retail (down 7%) and net lease were the two worst-performing sectors between May and June (also down 7 percent ). Since before the pandemic, strip retail had increased by 7%, and in the past year while economies were recovering, it had increased by 15%. Before Covid, net lease saw a 6% growth and a 5% 12-month growth.
It’s interesting to note that the third highest decline, from May to June, was in the industrial sector, which has been particularly hot since the epidemic, growing at a rate of 42 percent and rising 15 percent over the past 12 months.
Manufactured home parks have done well generally, with a 17 percent growth over the past 12 months, up 33 percent prior to Covid, and no loss between May and June, despite general stresses on the availability and cost of rental accommodation.
Another industry that has fared well in the face of economic and societal pressures is self-storage, which has grown by 58 percent since before Covid, by 28 percent over the past 12 months, and by a lower-than-average 4 percent during the most recent recorded month.
Office decreased by only 4% in the most recent month, but was down 1% over the previous 12 months and -9% since before the epidemic. Consequently, the net result is negative.
Multifamily has increased by 15% over the past 12 months and by 16% since before the epidemic, although it has decreased by 4% during the past month.
After the sharp rise in prices in so many categories over the previous two years, it was fair to wonder how much higher prices, as well as rents paid by consumers and businesses, could rise. There were numerous indications that price growth was beginning to slow down.
Housing prices have started to decline, but the lack of available inventory has prevented a collapse, and investor purchases of SFR are rising. Over the next six months, CoStar anticipates a decline in demand for multifamily housing.
We are ready to assist investors. For questions about Commercial Real Estate for sale and Commercial Real Estate Listings contact your Los Angeles commercial real estate advisors at SVN Vanguard.
1. Jobs Report
- Despite rising capital costs and renewed recession fears, the US economy added 372k jobs in June, according to the latest employment numbers from the Bureau of Labor Statistics.
- Business Services led the way with 74k new payrolls in June. Management roles had the largest increase within the industry, with 12k jobs added in the month.
- Leisure and hospitality had a strong month with 67k new jobs added in June. Food services and drinking places continued to grow, adding 41k of all Leisure and Hospitality job gains. According to the Federal Reserve’s most recent beige book release, most of the nation is reporting an increase in travel and recreational activity. Still, employment in Leisure and Hospitality remains down by 1.3 million or 7.8% since February 2020.
- The unemployment rate remained unchanged at 3.6%, where it has sat for the past four months. The number of unemployed persons was also unchanged at 5.9 million.
- The Labor Force participation was little changed at 62.2% and remains below the 63.4% registered at the labor market’s pre-pandemic peak in February 2020.
2. Inflation and Inflation Expectations
- The Consumer Price Index (CPI) rose 9.1% year-over-year through June according to the Bureau of Labor Statistics, another four-decade-plus high for the popular inflation gauge.
- Core-CPI inflation, which excludes food and energy prices and is more consequential for policymakers, appears to have peaked at 6.5% in March and has nicked down in each successive month since. Nonetheless, the continued pressure on food and energy prices continues to be a significant concern for policymakers and forecasters.
- The energy sub-index of CPI rose 7.5% in just the past month and accounted for almost half of overall price increases in June.
- Inflation-adjusted or “real” incomes reduced by 1% in June and are down 3.6% from one year ago, according to data from both the CPI and Jobs reports.
3. Beige Book
- Several of the twelve Federal Reserve districts reported growing signs of slowing demand, with at least five districts concerned about an increased risk of a recession, according to Fed’s July 13th Beige Book release.
- Overall economic activity has been expansive since mid-May, but most districts reported a moderation in consumer spending as higher food and gasoline prices soaked up households’ discretionary income.
- Auto sales remained sluggish, largely due to low inventory rather than slowing demand. Meanwhile, manufacturing activity was mixed, with several districts reporting that supply chain and labor issues
continued to slow down production.
- Hospitality and tourism activity remains strong, with several districts reporting an uptick in group travel.
- Housing demand continues to noticeably weaken. Growing concerns about affordability is believed to have contributed to non-seasonal declines in sales, causing inventory to climb and prices to moderate.
- Commercial Real Estate conditions also slowed, while overall loan demand was mixed across most districts. Demand for consumer credit lines has grown while residential loan demand has weakened in the face of higher interest rates.
4. NMHC Construction Survey
- Developers reported continued permit delays, materials price increases, and labor market tightness, according to the latest Quarterly Construction Survey conducted by NMHC in early June.
- 97% of respondents reported permitting delays—though the backlog has been consistent through the pandemic and is evident of similar labor and resource shortages being felt by state and local governments.
- 83% of respondents report that they have had to re-price deals over the past three months. Repricing has improved since March—the average project in June was repriced up by 11% compared to 25% three months ago.
- Developers reported a 5% decline in lumber prices over the past three months, a reversal from the
previous quarterly survey.
- Labor shortages are impacting over half of apartment developers. 53% report increased labor costs over expected levels within the last three months. 50% report that labor availability has remained the same compared to three months ago, while 40% report that availability has worsened.
5. CMBS Delinquencies
- The CMBS delinquency rate posted a small but unexpected uptick in June, climbing 6 bps and landing at 3.2%, according to data by Trepp. The uptick was only the second over the past two years, with the last increase occurring in late 2021.
- Each of the major property sectors saw a slight increase in delinquencies last month, with 0.18% of all loans now in the 30 days delinquent bucket— up five bps from May. The percentage of loans with special services fell to 4.91, a decline of 21 bps from May.
- By sector, Industrial remained on the most solid footing (0.23%) but saw delinquencies climb by 11 bps month-over-month in June. Multifamily (1.04%) is up 2 bps from May. Office (1.28%) rose 5 bps. Lodging (5.08%) is up 6 bps from May while Retail (5.69%) is up 14 bps.
6. Gas Prices
- Wholesale gasoline futures are falling, with unfinished gas, commonly referred to as “RBOB” down roughly 20% since its June 9th high. Prices at the pump often follow RBOB prices.
- The average price per gallon at the pump stood at $4.63, down 15 cents from the week prior and down 38% over four weeks, according to AAA. Gasoline prices have now declined for 28 days straight.
- According to an analysis by the NY Times, energy analysts say that Americans are spending in total $140 million less per day at the pump than they were one month ago.
- Despite a massive, 11.2% month-over-month increase for the all-gasoline sub-index of CPI in June, fuel oil posted a -1.2% month-over-month decline over the same period.
7. Office Demand
- New Office demand ticked up in May, according to the VTS Office Demand Index (VODI).
- Office demand has essentially plateaued since March, falling into what appears to be a new post-pandemic equilibrium. However, VODI is up 21.8% quarter-over-quarter as the office market has shaken off the temporary headwinds induced by the omicron wave. VODI is down 14.1% year-over-year.
- On a metro level, many metros showed slight recoveries in May but remain below their post-vaccine peak. New York City saw a notable increase of 12.7% month-over-month in May and 31.1% quarter-over-quarter. However, the Big Apple remains 16.7% below its post-vaccine peak in Fall 2021.
- Other metros that saw Office demand climb were San Francisco (+2%), Boston (+3%), and Seattle (+9%). Declines were seen in Chicago (-14%), Washington D.C. (-2%), and Los Angeles (-1%).
8. GDPNow Predicts Recession
- A growing number of analysts, institutions, and key indicators are increasingly signaling signs of a recession, and the Atlanta Federal Reserve’s GDPNow index just became the latest metric to flash a
warning sign.
- According to the latest GDPNow update (July 8th), seasonally adjusted real GDP growth is expected to
register an annualized -1.2% decline in Q2 2022.
- While the GDPNow forecast finished the week stronger than it had started, the predictions add to the grey cloud hovering above markets. Following Friday’s jobs data and wholesale trade reports from the BLS and Census Bureau, respectively, GDPNow revised up real personal consumption expenditures from 1.3% to 1.9% annualized, and private investment was revised up from -14.9% to -13.7%, annualized.
9. The Hot Market for Cold Storage
- Cold Storage, which saw an influx of interest during the pandemic as increased demand for food delivery, groceries, and vaccine distribution poured money into those assets, faces an uncertain future as we move into the post-pandemic phase.
- Overall, high demand remains, with the average vacancy rate standing at 3.5% for Cold Storage properties according to an analysis by Wealth Management.com. Cold Storage is seeing lower vacancy rates than overall traditional warehouse space.
- High population, a large volume of agricultural imports, proximity to large ports, and limited space for cold storage are thought to be the key factors aiding asset pricing. Jacksonville, Detroit, and South New Jersey stand out as examples of where this is taking place, according to the analysis.
- Historically, Cold Storage has been dominated by a handful of specialized REITs, but in recent years, the sector has attracted interest from private equity and institutional capital.
10. Apartment Development Risks
- While apartment demand remains strong in the face of growing economic uncertainty, the industry should remain on the lookout for oversupply risks, according to an analysis by Apartments.com and CoStar.
- Multifamily construction stands at its highest level in 40 years with over 842k units currently in development. Recent trends largely reflect an attempt to catch supply up to soaring apartment demand,
which has been responsible for some of the fastest residential rent growth on record.
- However, the analysis looked at metros that fall into three categories: Markets with the greatest rise in apartment vacancies over the past year; markets that have experienced the steepest rent growth
declines over the past year; and current supply levels compared to the previous three-year average.
- The analysis found that Phoenix, Tampa, and Austin could be candidates for potential overbuilding using the three metrics, as both Phoenix and Tampa fall in the top 10 for all three categories, while Austin does for two categories and registers at #11 in a third. Raleigh and Las Vegas, while considered as high-risk as the previous three, came in close behind.
SUMMARY OF SOURCES
- (1) https://www.federalreserve.gov/newsevents/pressreleases/monetary20220615a.htm
- (2) https://www.bls.gov/news.release/cpi.nr0.htm
- (3) https://www.federalreserve.gov/monetarypolicy/beigebook202207.htm
- (4) https://www.nmhc.org/research-insight/nmhc-construction-survey/quarterly-survey-ofapartment-construction-development-activity-june-2022/
- (5) https://www.trepp.com/trepptalk/monthly-snapshot-cre-structured-finance-banking-activityin-june-as-first-half-of-2022-concludes
- (6) https://gasprices.aaa.com/
- (7) https://www.vts.com/vts-office-demand-index-may-2022
- (8) https://www.atlantafed.org/cqer/research/gdpnow
- (9) https://www.wealthmanagement.com/industrial/consumers-take-step-back-home-deliverieswill-cold-storage-remain-hot-asset-type
- (10) https://www.globest.com/2022/07/06/the-apartment-markets-at-greatest-risk-foroversupply/COMMERCIAL
1. CONSUMER PRICE INDEX
- Consumer prices rose 8.6% year-over-year through May, according to the Bureau of Labor Statistics’ Consumer Price Index (CPI). May’s reading brings inflation back up to its forty-year high last reached in March, reversing what appeared to be declining price pressures in April.
- Prices rose 1.0% month-over-month, jumping from a more modest 0.3% monthly growth rate the month prior. If prices grew at this rate over the course of one year, the annual inflation rate would reach 12.3%.
- Core CPI, which excludes food and energy prices, again accelerated on a month-over-month basis, rising from 0.56% in April to 0.63% in May.
- Energy prices continued their climb in May after moderating slightly in April. Month-over-month, energy prices are up 3.9%. Measured year-over-year, energy prices are up by 34.4% — the worst reading since 2005.
2. CONSUMER SENTIMENT
- According to the University of Michigan, preliminary results for consumer sentiment dipped to their all-time low in June, declining to an index reading of just 50.2. Measured month-over-month, the index is down 14.0%. Year-over-year, the index has fallen by an abysmal 41.3%.
- June 2022’s preliminary consumer sentiment index reading is 21.6 index points off from where it sat in April 2020 and 50.8 index points off where it entered the pandemic in February 2020.
- As noted by the University of Michigan researchers conducting the survey, half of the respondents spontaneously mentioned high gas prices during their interviews — up from 30% in May and 13% one year ago.
- The median consumer surveyed expects gas prices to rise by 25 cents per gallon over the next year — more than doubling the median expectation in May and coming in as the second-highest reading since 2005.
3. LOGISTICS MANAGERS INDEX
- The Logistics Managers’ Index (LMI), a diffusion index where above 50 signals expansion and below is contraction, declined for the second straight month in May to 67.1, its lowest reading since December 2020 and just two months after reaching an all-time high of 76.2 in March.
- Transportation capacity grew significantly over the month, jumping to 64.7, the highest since October of 2019. This is helping ease supply pressures but is also causing utilization rates to fall, placing downward pressure on transportation prices. The growth rate for transportation prices decelerated from an index mark of 73.9 to 64.3.
- Inventories remain high while warehouses enter their 21 consecutive months of falling capacity rates — mainly due to stalled shipping containers unable to undock goods because of an available space
shortage.
4. MBA MORTGAGE APPLICATIONS
- According to the Mortgage Bankers Association’s (MBA) Market Composite Index, mortgage applications in the US saw further declines in the week ending on June 3rd, which fell 6.5% from the previous week, according to the Mortgage Bankers Association’s (MBA) Market Composite Index.
- Rising mortgage rates alongside high buying prices appear to be steadily weakening demand. Mortgage applications have now fallen for four consecutive weeks and have only registered six week-over-week increases since the start of the year. The volume of both purchase and refinance applications sank this week.
- The average contract rate on a 30-year mortgage rose to 5.4% from 5.33%.
5. WORKPLACE OCCUPANCY
- Workplace occupancy fell by 1.7% during the week ending on June 1st to a rate of 41.2%, according to Kastle Data Systems’ Back to Work Barometer. Much of this was due to the Memorial Day holiday, but attendance has fallen for four consecutive weeks.
- Of the top metros tracked, Chicago saw the steepest one-week change, falling by 2.7%. Followed by Austin (-2.4%) and Houston (-2.1%). No major metros tracked saw an increase in attendance from the week before.
- Compared to other in-person activities impacted by the pandemic, office occupancy remains far behind 2019 levels. Dinner reservations via Open Table data have recovered to 86.6% of 2019 levels, while TSA checkpoints have recovered to 90.7% of 2019 levels.
6. TECH WORKERS AND REMOTE WORK
- A study by Morning Consult of about 750 tech workers shows that about 48% say they are now fully remote, well above the 22% observed before the onset of the pandemic.
- 85% of tech workers say that they are either fully remote or are in a hybrid setup. Roughly 3 in 5 tech workers say they are not interested in returning to the office full time, while separate 2 in 5 are more open to in-person work.
- Just a third of tech workers said they have “never” considered resigning — roughly in line with pre-covid trends.
- Tech companies stood out both early in the pandemic as well as into the reopening period, largely embracing remote work policies, but many are seeking a more robust return to the office in 2022.
7. CONSTRUCTION SPENDING
- US Construction spending rose by 0.2 percent month-over-month between March and April to a seasonally adjusted annual rate of $1.745 trillion. This followed a 0.3 percent jump in March but comes in 30 basis points below market expectations.
- Private construction spending rose 0.5% in the month, fueled by increases in manufacturing spending (1.6%), single-family home construction (0.5%) and office infrastructure (0.1%). Spending on power (-1.5%) and commercial construction (-0.2%) fell during the month.
- Construction spending has now fallen for three consecutive months and in four of the last five months.
8. YIELD CURVE AND PREDICTED GDP GROWTH
- The yield curve (in this example, the spread between the 10-year and 3-month Treasury bill rates), a popular barometer for recession risk, saw its slope begin to normalize in May after a flattening in April, according to an analysis by the Cleveland Federal Reserve. A flattening or an inversion of the yield curve is often read as an increase in recession risk.
- The Cleveland Fed’s Predicted GDP growth metric for the year was unchanged at 4.9%, while the probability of a recession within one year dropped 10 basis points to 2.6%.
- The calculated metric uses past values of the yield curve slope and GDP growth to provide forecasts of future GDP growth recession probabilities. A number of banks and economist surveys have begun to warn in recent weeks of a heightened probability of a recession as the Fed hikes interest rates to try and cool inflation.
9. SPECIAL SERVICING RATES
- The CMBS Special Servicing Rate, a barometer for levels of stress among borrowers, fell 18 basis points in May to 5.12%. The rate has fallen from a pandemic high of 8.65% just 12-months ago.
- The lodging sector saw the largest month-over-month improvement, falling by 56 basis points to 8.42% in May. Both Retail and Multifamily fell 20 basis points over the month, but Retail continues to have the highest special servicing rates by sector at 10.86%, while Multifamily enjoys one of the lowest at 1.29%. Industrial fell by 7 basis points to 0.46% and remains the lowest distressed sector. Meanwhile, Office ticked up by 1 basis point in May to 3.36%.
- The percentage of loans on the special servicer watchlist fell to 22.35%, its eighth consecutive monthly decline.
10. CMBS DELINQUENCIES
- CMBS delinquencies fell 37 bps to 3.14% in May from the month before, according to Trepp. It was the biggest one-month decline since January. The delinquency rate has now fallen in 22 of the last 23 months.
- The CMBS delinquency rate climbed as high as 10.32% during the thick of pandemic-related headwinds in June 2020. This was only 2 bps short of the all-time high rate of 10.34% reached in July 2012.
- By sector, Retail delinquencies fell the most from last month, dropping 79 bps to 6.57% in May. Lodging dropped by 51 bps to 5.83% during the month. Multifamily delinquencies fell by 18 bps to 1.01%. The Industrial delinquency rate declined 13 bps to 0.38%, while Office fell just 8 bps to a rate of 1.83%.
SUMMARY OF SOURCES
- (1) https://www.bls.gov/cpi/
- (2) http://www.sca.isr.umich.edu
- (3) https://www.the-lmi.com/
- (4) https://www.mba.org/
- (5) https://www.kastle.com/safety-wellness/getting-america-back-to-work/#workplace-barometer
- (6) https://morningconsult.com/2022/05/31/tech-workers-survey-office-hybrid-remote-work/
- (7) https://www.census.gov/construction/c30/c30index.html
- (8) https://www.clevelandfed.org/en/our-research/indicators-and-data/yield-curve-and-gdp-growth/background-and-resources.aspx
- (9) https://www.trepp.com/hubfs/Trepp%20CMBS%20Special%20Servicing%20Report%20May%202022.pdf?hsCtaTracking=66cab05f-96c0-43f6-be25-e715a6b765e0%7Cce07558c-1801-4b1d-8b92-a8aa565a47f2
- (10) https://www.trepp.com/hubfs/Trepp%20Delinquency%20Report%20May%202022.pdf?hsCtaTracking=cd011a9d-0cd0-46bb-a0ed-006398f7148e%7Cdef0f2d1-7a5c-4bb7-a444-688182e66081
COMMERCIAL
1. CONSUMER PRICE INDEX
- Consumer prices rose 8.3% year-over-year through April, according to the Bureau of Labor Statistics’ Consumer Price Index (CPI). April’s reading was the first reduction in annual inflation since August 2021, but price pressures remain near 40-year highs.
- Prices rose just 0.3% month-over-month, a modest reduction from the monthly rates registered at the start of the year and the lowest 30-day increase since September. If prices grew at this rate over the course of one year, the annual inflation rate would sit at 4.1%.
- Core CPI, which excludes food and energy prices, accelerated on a month-over-month basis, rising from 0.3% in March to 0.6% in April.
- Energy prices moderated after facing significant pressures in March. The overall energy subcomponent of CPI fell by 2.7% month-over-month, down from an increase of 11.0% in March.
2. APRIL JOBS REPORT
- Nonfarm payrolls increased by 428k in April, according to the Bureau of Labor Statistics. The unemployment rate held steady at 3.6%, while the number of unemployed persons remained virtually unchanged at 5.9 million.
- Jobs in leisure and hospitality, the hardest-hit sector from the pandemic and one of the leading recovery categories, have slowed for five consecutive months. While continued gains are positive, the slowing of growth as COVID-related impacts wane may indicate a cyclical hiring peak for the sector.
- Construction added just 2k jobs in April, down significantly from 20k in March and 54k in February. The slowdown is notable given that the sector typically sees a seasonal ramp-up of hiring in the Spring. Further, the slowdown may be indicative of the qualified labor shortage the sector has faced in recent months.
3. INTEREST RATES AND YIELD CURVES
- At its May meeting, the Federal Reserve’s policy-setting committee raised interest rates by 50 basis points from a range of 0.25%-0.50% to a range of 0.75%-1.00%. The policy move was the first half-percentage point hike by the Fed since 2000, and it follows its initial quarter-percent point hike in March that began the tightening cycle.
- While a Summary of Economic Projections was not released alongside the May policy meeting, forecasts tabulated by the Chicago Mercantile Exchange’s Fed Watch Tool show an average year-end projection of 2.75%-3.00% for the Federal Funds Rate.
- Yields on the 10-year Treasury pulled back to 2.84% on Thursday, May 12th, as investors continue to run for safety in bond markets given recent selloffs in stocks and little relief from this week’s inflation data. The yield on the 30-year Treasury dropped 5 bps to 2.99%.
4. EY WORK REIMAGINED SURVEY
- A new survey by Ernst & Young dives underneath the “Great Resignation” surface to detail employees’ motivations and shifting sentiments. Workplace flexibility was of particular focus, with 80% of employees indicating a desire to work from home at least two days per week and just 20% indicating a hesitance towards fully remote working.
- Notably, workers with shorter commutes are more open to working in the office. For employees with less than a 30-minute commute, roughly 40% are comfortable with a full return to the office. This drops to 25% for employees with a commute of more than 60 minutes.
- 68% of employers say that turnover has increased in the past 12 months, while 43% of employees say they will likely leave their current employer within the next year — up from just 7% in the last year’s survey. Percentages are higher for Gen-Z and millennials compared to older generations.
5. COMMERCIAL AND MULTIFAMILY ORIGINATIONS
- Originations for both Commercial and Multifamily mortgages rose by 72% in Q1 2022 compared to Q1 2021, according to recent data from the Mortgage Bankers Association.
- Loan originations fell quarter-over-quarter from Q4 2021, falling 39% but remain in line with typical seasonality trends. MBA Vice President of Commercial Real Estate Research Jamie Woodwell says that the “strong momentum in commercial and multifamily borrowing and lending at the end of 2021 carried into the first quarter,” indicative of continued strong demand for certain property types, notably Industrial and Multifamily.
- By property type, Hotel originations increased the most year-over-year, rising by 359%. Industrial increased by 145% year-over-year, while Retail climbed by 88%. Originations for Health Care properties rose by 81%, while Multifamily increased by 57%. Office dropped by 30% year-over-year. On a quarter-over-quarter basis, declines were widespread due to seasonal trends.
6. EVICTIONS
- An ongoing weekly tracker by the Cleveland Fed that has tracked eviction filings throughout the pandemic finds that evictions are falling relative to 2019 levels, particularly in places that did not have blanket eviction bans in place over the past two years.
- Between April 22nd and April 30th, the latest dates of data availability, in areas with no previous local eviction ban, evictions fell 8.6% below their 2019 comparative week benchmark.
- Almost all eviction protections have been lifted since the start of the year, and the Fed data lends support to the idea that the risk of an “avalanche” of evictions was likely overstated. Still, evidence of rising stress has surfaced in recent weeks as emergency rental assistance continues to stall and dry up, and rising rents create affordability issues.
- HUD recently announced that it would double the size of its eviction protection program, which helps tenants seek legal assistance during proceedings.
7. STOCK MARKET VOLATILITY
- Beyond recent yield curve drama in bond markets, equity markets have experienced an uptick in volatility in recent weeks as the Federal Reserve policy changes alongside rising geopolitical risks unnerve markets.
- CBOE’s Volatility Index, better known as the “VIX,” finished at 34.75 on Monday, May 9th, up from 21.16 one month earlier. The VIX typically experiences daily fluctuations but has been in a heightened state since late January, when warnings of an impending Russian invasion of Ukraine started to spook markets. Since the actual invasion has taken place, VIX has become more elevated and reacted to other uncertainty-inducing events, such as the COVID lockdowns in China and a shift in Fed policy.
8. NMHC APARTMENT SURVEY
- The NMHC’s Market Tightness Index registered an observation of 60 in the second quarter of 2022 — remaining above 50 for the fifth consecutive quarter, reflecting a still tightening market. Still, the index has now come down for three straight quarters after reaching a high watermark of 96 in Q3 2021.
- The Equity and Debt Financing Indicines dropped to 35 and 9, respectively, signaling an overall challenging capital raising environment amid rising interest rates and growing market volatility.
- When asked about to what extent respondents are worried about rising inflation and interest rates, 42% reported being “very concerned,” while 55% were “somewhat concerned.” Only 3% reported being either “not at all concerned” or unsure.
9. NAIOP CRE SENTIMENT INDEX
- NAIOP’s bi-annual CRE sentiment index remained above 50 in its April release, a sign that more favorable market conditions are expected over the next 12 months. At the same time, the index fell from 56 in its prior release (September 2021) to 53 in April, marking declining optimism.
- In a shift from the September 2021 results, most respondents expect cap rates across CRE to rise this year, reflecting the impact of rising interest rates and inflation.
- CRE professionals firmly believe that both construction materials costs and construction labor costs will rise appreciably this year.
- While equity financing conditions remain slightly positive (index reading = 51), respondents are pessimistic about the availability of debt, as its index fell from 54 in September 2021 to 39 in April 2022.
10. NY FEDERAL RESERVE HOUSING SURVEY
- According to the New York Federal Reserve’s SCE Housing Survey, renters are increasingly pessimistic about their ability to buy a home in the current market environment. Only 42% of renters in the 2022 survey think they will buy a home in the next three years — down 10 percentage points from 2021.
- Contributing to the outlook are current perceptions of underwriting standards. 33.5% of renter respondents felt it would be very difficult to obtain a mortgage, while an additional 29.7% thought it would be somewhat difficult.
- Only 20.5% of renter respondents felt it would be very or somewhat easy to obtain a mortgage — a decline of 5.5 percentage points from last year.
SUMMARY OF SOURCES
- (1) https://www.bls.gov/news.release/cpi.nr0.htm
- (2) https://www.bls.gov/news.release/empsit.nr0.htm
- (3) https://www.federalreserve.gov/monetarypolicy/files/fomcprojtabl20220316.pdf
- https://www.cnbc.com/2022/03/16/federal-reserve-meeting.html
- (3) https://www.cnbc.com/2022/05/12/us-bonds-treasury-yields-fall-following-hot-inflation-data.html
- (4) https://www.ey.com/en_gl/workforce/work-reimagined-survey
- (5) https://www.mba.org/news-and-research/newsroom/news/2022/05/12/commercial-multifamily-borrowing-jumped-72-percent-in-the-first-quarter-of-2022
- (6) https://www.clevelandfed.org/en/newsroom-and-events/publications/community-development-briefs/db-20200902-data-updates-measuring-evictions-during-the-covid-19-crisis.aspx
- (6) https://www.nbcnews.com/business/consumer/federal-eviction-protection-program-doubles-funding-rcna28005
- (7) https://fred.stlouisfed.org/searchresults?st=vix
- (8) https://www.nmhc.org/research-insight/quarterly-survey/2022/nmhc-quarterly-survey-of-apartment-conditions-april-2022/
- (9) https://www.naiop.org/Research-and-Publications/Sentiment-Index
- (10) https://www.newyorkfed.org/microeconomics/sce/housing#/renters_1COMMERCIAL

National Overview
OFFICE
As the pandemic sent corporate America from boardrooms to bedrooms in 2020, long-held assumptions about productivity are now rightfully up for debate. On one side of the spectrum are those that argue that office spaces facilitate an agglomeration of ideas, culture, and productive output. On the other hand, many argue that long commutes into places of work are outdated norms, and the commute time saved by remote work can generate both greater worker productivity and improved quality of life — a classic case of having the cake and eating it too. Now, with 2021 in the rearview, and after two distinct COVID waves derailed back-to-office timelines, there has been little resolution to the so-called big questions from a year ago.
According to The Pew Research Center, as of January 2022, for American adults who report being able to complete their jobs from home, 59% are doing so most or all of the time, and 18% do so some of the time. The VTS Office Index (VODI), which measures new Office leasing demand, remained down by 42% relative to its pre-pandemic benchmark through the end of 2021. As the public health threat lessens, these data will undoubtedly improve, but the question is by how much. In a tight labor market, the desires of workers can quickly transition into leverageable demands.
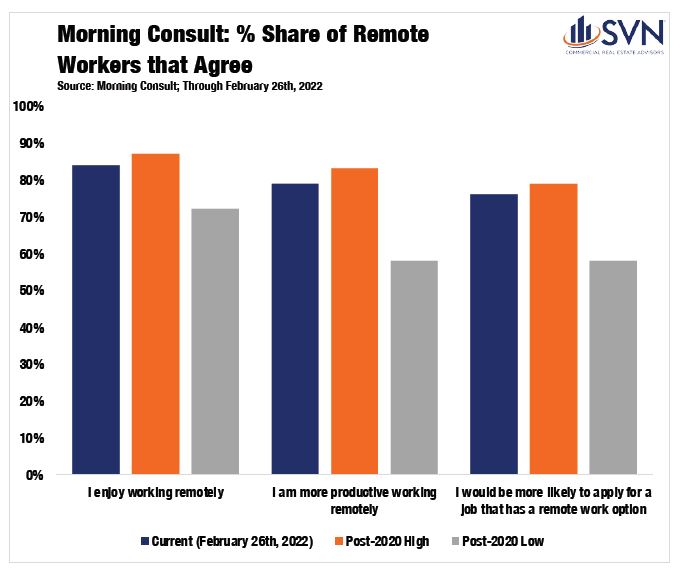
According to Morning Consult’s tracking of remote workers, 84% have enjoyed being remote, 79% feel they are more productive working remotely, and 76% would be more likely to apply for a job that offers remote work.1
SVN® Product Council Office Chair Justin Horwitz notes that “arguably, Office properties were the most negatively impacted of all the product types as a result of the pandemic.” However, he holds that 2021 was a year of recovery as sales volumes came back to peak levels thanks to returning “investor demand for quality office buildings, […] particularly for well-stabilized assets in strong locations.”
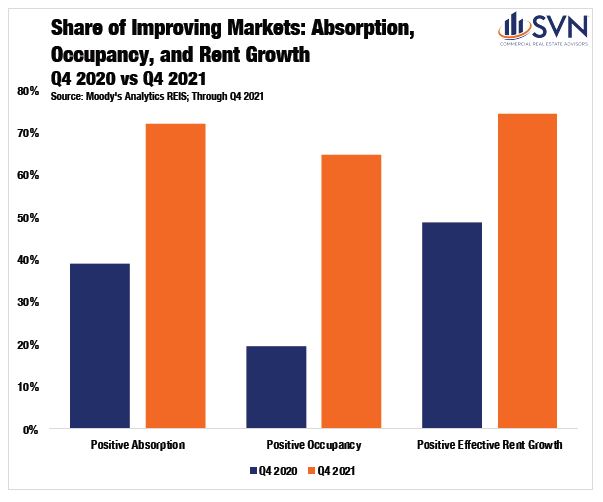
In their Q4 2021 report, Moody’s Analytics REIS attests that while the stage was set for Office sector distress in 2021, the incoming performance data failed to show it.2 Effective rent growth remained negative to begin last year but had returned to growth by the third quarter. Through Q4 2021, of the 82 markets that Reis tracks, 59 had positive absorption, 53 had improving occupancy, and 61 saw improving rent growth — a stark contrast from one year ago.
The open questions over the workplace of the future and its role in our daily lives appear most pertinent to Gateway markets such as New York. According to New York’s MTA, ridership of NYC’s subway system is forecast to be a long way off pre-pandemic ridership levels through 2025.3 Moreover, many of its stations seeing the largest declines in ridership are in Central Business Districts (CBDs) such as Midtown and Manhattan’s downtown Financial District.
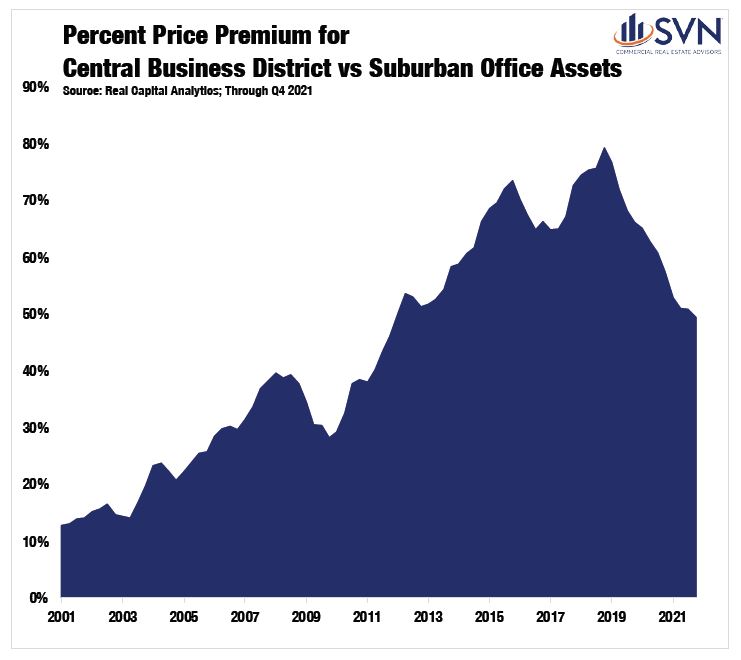
Outside of Gateway markets, the picture on the horizon appears a bit rosier. According to a Chandan Economics analysis of Real Capital Analytics data, Suburban Office valuations continue to soar. Over the past three years, the relative price per square foot premium an Office sector investor would have to pay for a CBD asset over a Suburban asset shrank from 79% to just 49%. Mr. Horwitz notes that “suburban markets are the beneficiary of businesses adjusting to the “new normal.”
Financial Performance
TRANSACTION VOLUME
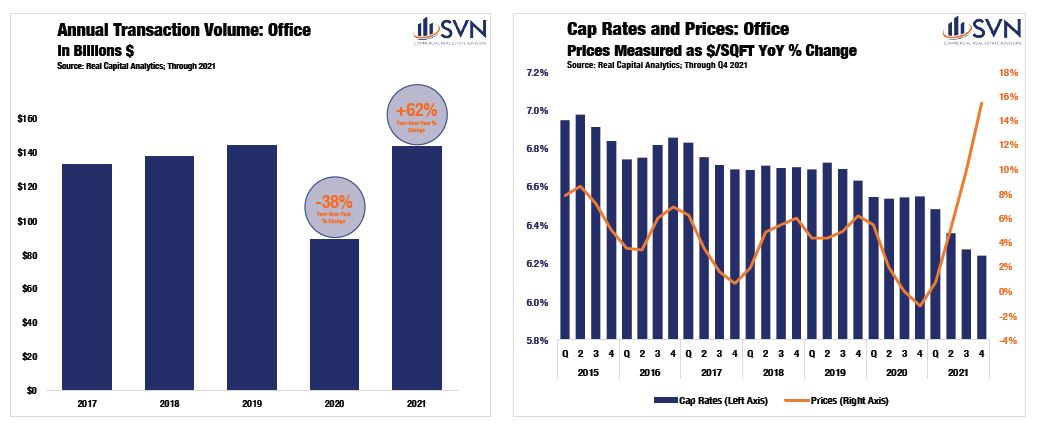
Transaction volumes for Office assets saw considerable improvement in 2021. According to Real Capital Analytics, more than $139 billion of asset value traded hands last year, a 56.5% improvement over 2020’s total. Still, despite the improvement, the Office sector was the only major CRE property type that did not eclipse its 2019 peak in 2021, as transaction volumes fell about $5 billion short.4 While the resumption of strong trading volumes is encouraging, the apparent lack of pent-up demand that has been observed in other property types may signal continued concern for the sector as hybrid work figures to be a market-shaping force for years to come.
CAP RATES AND PRICING
Cap rates for Office properties declined steadily throughout 2021, finishing the year with a sector average of 6.2% — down 31 bps year-over-year.5 Suburban Office assets continued their bull run in 2021 as pandemic-induced migration patterns and remote work adoption has proven broadly supportive of suburban commercial real estate at the expense of central cities, especially in Gateway markets. Last year, cap rates for suburban Office assets sank by 38 bps, settling at 6.3%.6 As recently as mid-2019, the cap rate spread between suburban and Central
Business District located Office assets stood as high as 147 bps.7 Through Q4 2021, this spread has fallen to just 55 bps.8 Medical Office assets also saw significant cap rate compression last year, declining 38 bps to 5.9%.9 Meanwhile, Single Tenant Office assets saw cap rates fall by just 4 bps, landing at 6.5%. Central Business District Office assets, the most maligned property group in the sector, saw cap rates rise by 18 bps in 2021, settling at 5.8%.10
Prices for Office assets finished 2021 up an average of 6.1% from the year earlier. Single Tenant Office assets were the clear laggard of the group, as prices increased by just 5.4% year-over-year through Q4 2021. CBD assets followed next with annual price appreciation rates of 10.4%. Again, Suburban and Medical Office properties were the clear winners in 2021, as prices grew an average of 15.1% and 15.5%, respectively.
Markets Making Headlines
TERTIARY WESTERN MARKETS ON THE RISE
The major Office success stories throughout the pandemic have come from outside of the traditional globalized markets like New York, San Francisco, and Los Angeles. Instead, outflowing residents and businesses from the traditional hubs into tertiary alternatives has generated momentum for a number of well-positioned smaller cities.
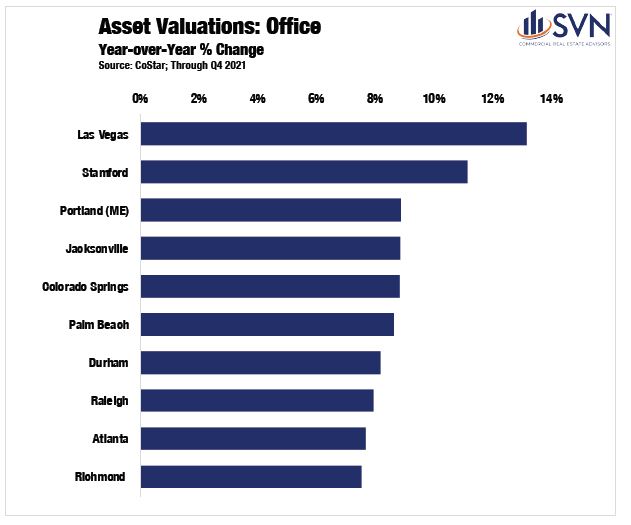
Nevada continues to be a standout in this area. Las Vegas seemingly has gleaned lessons from the Great Recession, and over the past decade, it has made significant progress in diversifying its labor market. Las Vegas led all other metros for the largest gains in Office sector property valuations last year (+13.2%), according to CoStar. For nearby Reno, it is a similar story. The rising competitiveness of Reno saw its Office sector post the nation’s third-biggest jump in rents (+4.9%) and the fourth largest jump in occupancy rates (+1.6%) last year.11 The Economic Development Authority of Western Nevada credits Reno’s recent success to a decade-long labor diversification plan adopted in Washoe County.12 Reno’s unemployment rate sat at a rock bottom 2.8% at the end of 2021 — 1.1 percentage points better than the national average.13
Moving beyond Nevada, several other secondary cities in the West continue to see their stock rise. San Diego posted a sizable jump in Office space net absorption totals in Q4 2021, coming in at 648,414 square feet, surging from just 2,913 square feet in the same period the year prior.14 Colorado Springs, CO, stands as a rare example of a metro where there are more employees today (310k) than there were entering the pandemic (305k).15 According to CoStar, the relatively small Colorado city posted the fifth biggest jump in Office sector valuations last year, rising a healthy 8.8%.16
In Spokane, WA, short-term headaches created by the pandemic are pitted against long-term improving fundamentals. According to Guy Byrd of SVN | Cornerstone, “Spokane’s CBD has been the weakest performing market in the last year as a significant number of tenants are choosing the increasingly popular hybrid work model.” He goes on to cite that “recruiting top talent and providing attractive work environments for workers who now prefer remote work is a significant new challenge.” Still, Washington State anticipates that Spokane will be a site for significant growth in the years ahead. While Spokane County is home to just over half a million people, the State’s Office of Financial Management projects that its resident population will swell by another 90k by the year 2040.17 Despite the ongoing headwinds, Mr. Byrd notes that vacancy rates improved last year as “users were forced to reinvent the most effective office environment.” Moreover, sales volumes also ticked up in 2021 “due to low interest rates and minimal new office construction,” a trend that forecasts should carry into 2022, “subject to economic conditions vital to the market.”
THE UNRETIREMENT COMMUNITY
Success begets success. Florida saw its population grow by 211k people in 2021 — more than every state not named Texas.18 With the influx of new residents, there is increased demand throughout all verticals of commercial real estate. After all, these incoming residents need places to live, places to shop, and places to work. Florida’s Office markets, including in suburban settings, saw statewide success in 2021.
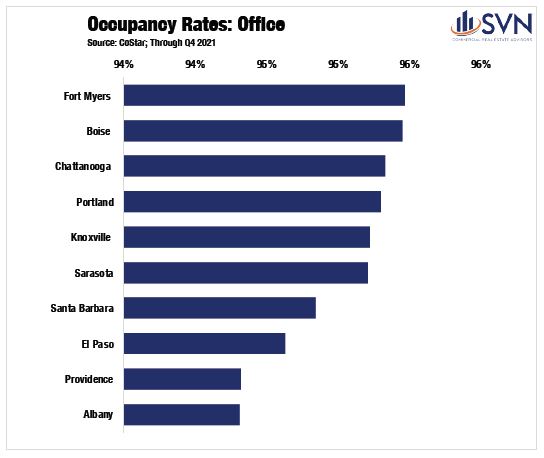
Fort Myers, a smaller Office sector compared to Florida’s more developed alternatives, has seen demand far outpace supply as it currently boasts the highest market-level occupancy rate (95.5%) in the country.19 Moreover, between the end of 2020 and the end of 2021, the Office occupancy rate rose by the second-highest clip in the country, growing by 1.8 percentage points.20
According to SVN | Commercial Advisory Group’s Larry Starr, Sarasota is “boasting some of the strongest office rent growth in the country,” a claim that is backed up by CoStar data, which shows rents in the area growing by 5.3% last year.21 “Office demand has remained strong in Sarasota throughout 2021, pushing vacancies to new lows.” In Tampa, a metro that has seen as much commercial real estate success as sporting success over the past half-decade, saw firming demand last year. Mr. Starr notes that Tampa remained a standout as “both asking rents and office demand improved throughout 2021, significantly outperforming the National Index.” Mr. Starr does see the potential for some softness in 2022, suggesting that Tampa’s office sector will be “challenged due to the increase in the amount of space available on the market,” as the pandemic triggered “the largest supply wave in over a decade.” Still, he sees the rising profile of Tampa and its ability to attract re-locating businesses as broadly supportive of the city’s long-term fundamentals, citing that “office investment activity has sharply increased with annual sales volume roughly doubling 2020 levels.”
Macro Economy
ECONOMIC GROWTH
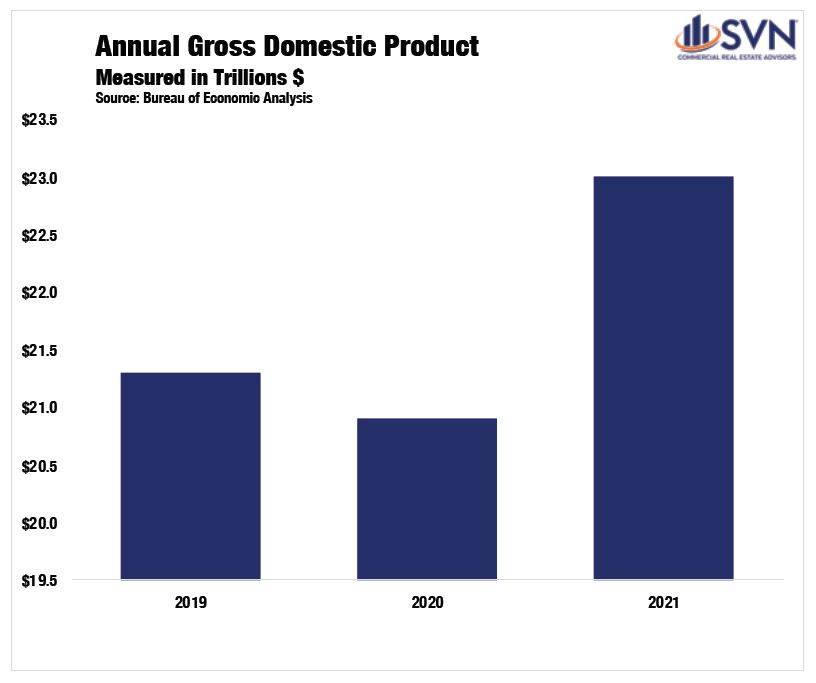
The US economy has experienced a robust recovery from the initial shock of COVID-19. A pandemic-driven shift in consumption away from services and into goods, boosted by a sweeping stimulus effort, reconditioned our economy well before an off-ramp from the public health crisis was in sight. By Q3 2020, inflation-adjusted GDP shrugged off its worst quarterly performance on record to record its best, a 33.4% annualized growth rate.1 In 2021, the total nominal value of all consumption and production reached $23.0 trillion, a 9.1% increase above 2020’s total and 6.9% above 2019’s total. After adjusting for inflation, the US economy is 3.2% larger than its pre-pandemic peak.2
The foundation of the economy’s rebound has been a swift labor market recovery. At its April 2020 peak, the official unemployment total reached a staggering 23 million people.3 By the start of 2021, the unemployment total had improved to just 10.1 million people out of work.4 Over the past year, this level has come down to 6.5 million people, less than one million above the pre-pandemic level of 5.7 million.5
INFLATION & MONETARY POLICY
One year ago, the market consensus was that the Federal Open Market Committee (FOMC) would not begin a monetary policy tightening cycle until 2023. However, as demand surges in the face of gummed-up supply chains, rampant inflation has emerged at center stage, forcing shifting guidance from policymakers.
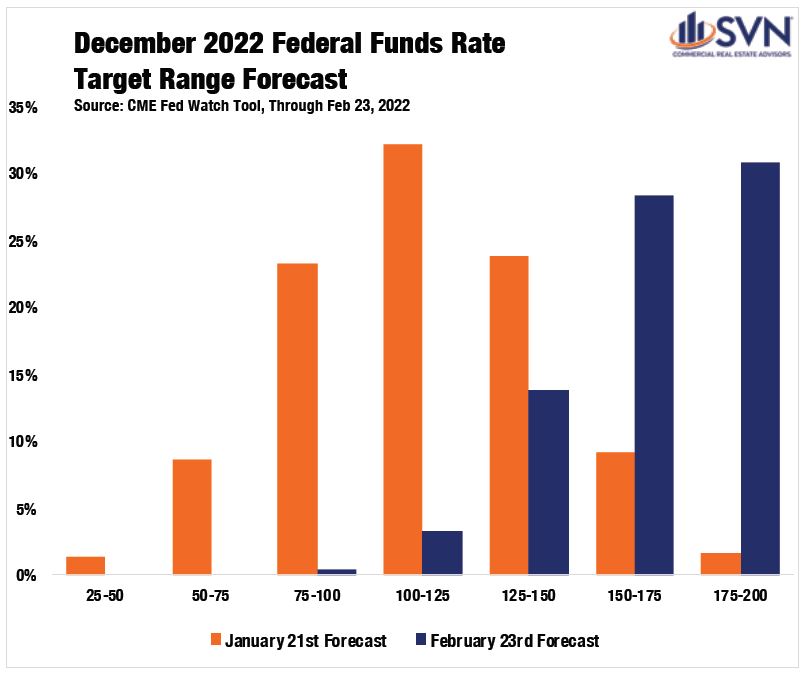
After decades of tepid price increases, in January 2022, the Consumer Price Index (CPI) reached 7.5%, a level not seen in 40 years.6 Core-PCE, the Federal Reserve’s preferred inflation gauge that excludes food and energy prices, reached 5.2% in January, prompting the FOMC to be increasingly committed to an interest-rate hike at its March 2022 meeting.7 In just 24 months, policymakers at the Federal Reserve have repositioned themselves from a tighter monetary policy stance into an accommodative one and back to a tightening one. According to the CME Fed Watch Tool, as of February 23rd, future markets are forecasting seven rate hikes by the end of the year — a sizable shift from even just one month earlier, when future markets were forecasting just four rate hikes in 2022. Volatile swings in the medium-term outlook are symptomatic of the rapid shifts in economic activity that categorized the past two years.
In December, Fed officials looked on cautiously at the near-term outlook as Omicron emerged as a roadblock to economic normalcy. After the Delta variant led to declining activity and sluggish job growth in mid-to-late summer 2021, some officials worried that Omicron, a more transmissible variant of COVID compared to previous waves, would hinder the recovery. While a significant wave of US cases followed, the Omicron wave proved to be less deadly and less straining on the US public health system than previous ones. As a result, an increasing number of US states and municipalities are relaxing masking and vaccine restrictions. On February 25th, the CDC introduced a new slate of guidelines that experts say shifts the US into the “endemic phase” of the pandemic. The new guidelines would put more than half of US counties and over 70% of the population in “low” or “medium” risk designations, bolstering the FOMC’s willingness to remove accommodative monetary policies.
THE GREY AREAS
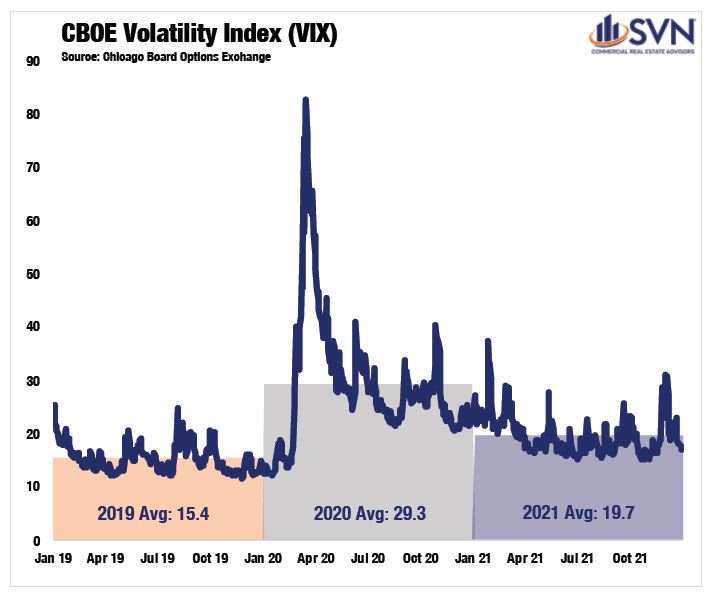
Still, a measurable dose of uncertainty overhangs stock markets and the whole macroeconomy. The VIX, a volatility index captured by the Chicago Board Options Exchange, has remained stubbornly elevated since the onset of the pandemic. Despite moderately retracting during the fall of 2021, the annual average for the VIX in 2021 was 19.7, 27.7% above its 2019 average.8
The SVN Vanguard team can help with your office real estate needs. We can help you find the ideal office property for sale or lease. Interested in discussing a sale-leaseback? Contact us.
NATIONAL OVERVIEW SOURCES
- Morning Consult, as of February 26th, 2022.
- Moody’s Analytics REIS, report found here: https://cre.moodysanalytics.com/insights/cre-trends/q4-2021-office-first-glance/
- https://www.osc.state.ny.us/files/reports/osdc/pdf/report-10-2022.pdf
- Real Capital Analytics; Through Q4 2021
- Real Capital Analytics; Through Q4 2021
- Real Capital Analytics; Through Q4 2021
- Real Capital Analytics; Throughout Q4 2021
- Real Capital Analytics; Throughout Q4 2021
- Real Capital Analytics; Throughout Q4 2021
- Real Capital Analytics; Throughout Q4 2021
- CoStar; Through Q4 2021. Note: Measured across the top-100 markets
- https://knpr.org/knpr/2022-02/northern-nevadas-economic-diversification-helped-soften-impact-pandemic-can-southern
- Bureau of Labor Statistics
- CoStar; Through Q4 2021. Note: Measured across the top-100 markets
- Bureau of Labor Statistics; Through December 2021
- CoStar; Through Q4 2021. Note: Measured across the top-100 markets
- https://www.krem.com/article/money/economy/boomtown-inland-northwest/spokane-county-future-growth/293-6859dcc0-bd63-40ef-8f16-c483fa61c9e1
- US Census Bureau
- CoStar; Through Q4 2021. Note: Measured across the top-100 markets
- CoStar; Through Q4 2021. Note: Measured across the top-100 markets
- CoStar; Through Q4 2021. Note: Measured across the top-100 markets
MACRO ECONOMY SECTION SOURCES
-
US Bureau Economic Analysis
-
US Bureau Economic Analysis
-
US Bureau Labor Statistics
-
US Bureau Labor Statistics
-
US Bureau Labor Statistics
-
US Bureau Labor Statistics
-
US Bureau of Economic Analysis
-
Chicago Board Options Exchange
1. CONSUMER PRICE INDEX
- Consumer prices posted an 8.5% year-over-year increase through March, its fastest annual pace since December 1981, according to the Bureau of Labor Statistics. Month-over-month, prices rose 1.2%.
- Energy continues to place the most upward pressure on prices, rising by 32.0% since March 2021. The impact of the Russia-Ukraine War and the ratcheting-up of Western sanctions on Russian oil exports in the past several weeks saw energy prices rise by 11.0% month-over-month in March— dwarfing recent months of data.
- Food prices for American consumers also continue to rise, posting a 1.0% rise for the second-consecutive month. This threshold has only been reached twice since 1990— during the height of the Great Financial Crisis and at the pandemic’s onset in April 2020.
- Prices excluding food and energy have climbed by 6.5% over the past 12-months but saw a noteworthy slowdown in upward movement during March, rising by just 0.3% in the month after five-consecutive months of +0.5% increases.
2. PRODUCER PRICE INDEX
- Producer prices have risen by 11.2% over the past 12-months and by 1.4% month-over-month through March, an uptick from 0.9 % in February, according to the latest release of the Producer Price Index by the Bureau of Labor Statistics.
- Goods prices contributed the most to the increase in March, rising by 2.3% and matching last month’s pace—while services rose by a more modest 0.9% month-over-month.
- Over half of the increase in final demand goods prices in March was due to energy, which climbed by 5.7% in March after an 8.2% pace in February. Diesel fuel prices led all energy-related increases during the month, jumping by 20.4%.
- The major contributor to the rise in services was a 22.7% increase in margins for fuels and lubricants.
- Producer prices minus food, energy, and trade services rose 0.9% in March, its fastest pace since January 2021. Over the past 12-months, prices for final demand minus foods, energy, and trade services increased by 7.0%.
3. COMMERCIAL PROPERTY PRICE INDEX
- The US National All-Property Price Index, which produces a weighted measure of commercial real estate prices, rose by 19.4% over the year ending February 2022, according to Real Capital Analytics (RCA).
- Industrial properties experienced the fastest annual rise in prices among the major property sectors, climbing by 28.5% year-over-year. Notably, this is the fastest annual pace of increase for any individual property type since the index’s inception.
- Apartment prices registered their fastest increase on record, climbing by 23.2% year-over-year through February 2022. Cap rates for both Apartment and Industrial have cratered to new record lows.
- Retail prices, which were still suffering from declines in early 2021, posted a 21.1% increase from last year, the fastest increase for the sector on record.
- Price growth in the Office sector was mixed, with CBD Office rising by 4.7% year-over-year after falling for much of 2021. On the other hand, Suburban Office price growth has started to decelerate but continues to fare better than CBD office with an annual increase of 10.1%.
4. RETURN-TO-NORMAL: SHOPPING
- A recent Morning Consult analysis on consumer sentiment surrounding a return to normal shopping activity found that 71% of US adults are comfortable going to a shopping mall, a pandemic-high for the survey, which sat as low as 17% when initially polled in May 2020.
- A 31% share of American shoppers claim to be spending more now than before the pandemic, and while much of that has come in the form of e-commerce, improving comfortability with in-person shopping could help brick-and-mortar retailers capture some of that growth.
- 47% of respondents say they are spending more online than they were pre-pandemic, while 9% say they are spending less and the remaining staying flat.
- By income group, the percentage of households with increased spending is about flat, but an estimated 15% of adults with income of $50k or less claim to spend “much more” than before the COVID-19 pandemic. The share of those with annual incomes of $50k-$100k who are spending “much more” than before is at 11%, while the share of those with incomes of $100k or more stands at 10%.
5. OFFICE TO APARTMENT CONVERSIONS
- A new study by Moody’s Analytics REIS calls into question the post-pandemic trend of adaptive reuse for Office conversions into apartment properties.
- The study focuses on the New York City metro, where offices have faced some of the most disruption from remote working, and apartment demand is likely to exceed that of the office sector. Their findings estimate that only 3% of the nearly 1,100 office buildings tracked met the characteristics of viable apartment conversions, with most being current class B or C offices buildings.
- The report notes New York’s unique exposure to low-occupancy risk for offices, given its high inventory, high cost of living, and a high share of jobs that can be performed remotely. But even in the Big Apple, it may be far-fetched to believe that a conversion wave is on its way.
- A key metric in the study is that despite the massive underutilization of New York’s office market in 2021, the median selling price for office properties transacted in 2021 stood at $542/SF. The report’s analysts estimate that at 2021 apartment transaction rates and average market conversion costs, developers would need to seek offices available at $262/SF to maintain current-market profit margins. Moody’s Analytics REIS estimates that only about 20% of New York’s office buildings traded at $262/SF or lower in 2021.
6. RENTER MIGRATION TRENDS
- A new report by Storage Café shows that Dallas suburbs emerged as the biggest destination for renter migration in 2021, with the local cities of Irving and Lewisville, TX, attracting the largest renter share of the population.
- Overall, rentership interest has grown over the past year, with a 10% increase in applications from 2020 to 2021. Urban centers have seen a strong rebound from their early-pandemic headwinds, but smaller cities within metro areas remain the preferred destination of apartment seekers.
- Rising to 3rd was Orlando, with the DC suburb of Arlington, VA, and the Orlando-adjacent Palm Bay, FL, rounding out the top-5. The trend holds further down the list, with Denver-adjacent Boulder, CO, taking 6th. Atlanta arises as an outlier at 7th, while the NYC-adjacent Jersey City takes 8th. Tempe, AZ, and Washington DC round out the top-10 markets.
- Millennials are the most on-the-move generation, according to the report. They are 2.6 times more likely to move than Gen Z and 2.6 times more likely to leave than Baby Boomers. In first-place Irving, TX, 57% of new renters in the town were Millennials.
7. THE CONSTRUCTION LABOR MARKET
- Increased labor demand in the construction market has been almost synonymous with the pandemic-era economy, and with the US Bipartisan Infrastructure Law estimated to create demand for 3.2 million new non-residential construction jobs, the competition for labor is likely to increase.
- A new study by McKinsey & Company estimates that 300,000 to 600,000 new workers would need to enter the sector each year to keep pace with demand, equating to a 30% increase in the non-residential construction workforce.
- Competition is likely to continue to place upward pressure on wages, which grew by 7.9% over a two-year period between December 2019 and December 2021. Labor demand in similarly skilled sectors is also playing a factor, with wages in the Transportation & Warehousing sector seeing growth of 12.6% over the same period.
- There are several factors at play that could have an impact on the construction labor market as we move beyond the pandemic. Many Baby Boomers moved up their retirements during the pandemic, causing a spike in retirement rates that may normalize as we move further away from the public health crisis. Similarly, issues surrounding childcare, mental health, and a shift in employee values that became more apparent during the pandemic are areas of opportunity for the labor market, the report notes. Further, a structural skills mismatch remains at play, with a decline in the output from training programs in recent years and a decline in international migration.
8. JOB OPENINGS AND LABOR TURNOVER SURVEY (JOLTS)
- Job openings were little changed at 11.3 million on the last business day of February, according to the most recent data by the Bureau of Labor Statistics.
- Job openings increased in arts, entertainment, and recreation, seeing a boost in demand from a tourism rebound and a springtime activity uptick. Openings in education services and the Federal government also increased during the month. Job openings decreased in finance and insurance and nondurable goods manufacturing.
- Hires rose to 6.7 million in February, up from 6.4 million in January. Total separations were little changed at 6.1 million. Within separations, the quits rate stayed relatively steady at 2.9%, while layoffs and discharges stayed unchanged at a 0.9% rate. The quits rate among US workers remains near its all-time high and has consistently trended above its pre-COVID peak since February 2021.
9. CROSS-BORDER INVESTMENT
- Boston became the top destination for overseas capital in 2021, according to RCA’s cross-Border market rankings. Boston climbed nine spots from 2020 to claim the #1 spot, which Manhattan had held since 2010. According to RCA’s analysis, tech-centric investments in the area dominated much of the foreign inflows.
- Manhattan maintained the second-place ranking but notably registered a smaller volume of cross-border deals in 2021 than in 2020, the only metro among the top-10 to do so. Atlanta, Phoenix, and Dallas came in 3rd, 4th, and 5th, respectively, with large and liquid industrial and apartment environments attracting investor dollars.
- Orlando posted the largest jump of any metro between 2020 and 2021, climbing from the #38 spot to the #10 spot, with a quadruple-digit increase in cross-border deals.
- San Francisco, which had placed in the top-10 markets for 10 of the past 12-years, fell to the #14 spot in 2021.
10. TECH MARKETS TO WATCH
- During the pandemic, the Tech Industry has emerged as a key trendsetter for the outlook of Office demand, strategically increasing its footprint in various markets over the past two years as they embrace evolving office norms. A Moody’s Analytics REIS analysis shows that by the end of 2021, office rents in tech markets averaged $39.23/SF compared to a national average of just $21.36/SF. Since 1999, rents in tech markets have risen by 50.9% compared to an average of 40.0% nationally.
- The report qualifies “tech markets” as a metro area where computer and math employment make up 5% or more of total employment or if the metro has over 100,000 total jobs in those occupations. 15 US metros currently meet the report’s definition, which includes several large-gateway markets and smaller hubs such as Raleigh and Colorado Springs.
- Other cities are emerging as tech hubs. 12 US metros meet Moody’s Analytics REIS qualifying criteria, which measures metro-areas with at least 10% more growth for computer and math occupations than the national average since 2018, or at least 4% more median annual wage growth for those occupations than the national average since 2015. These include Ventura, Buffalo, Greensboro, Miami, Greenville, Knoxville, New Orleans, Norfolk, San Bernardino, Nashville, Lexington, and Wichita.
SUMMARY OF SOURCES
- (1) https://www.bls.gov/news.release/cpi.nr0.htm
- (2) https://www.bls.gov/news.release/ppi.nr0.htm
- (3) https://www.rcanalytics.com/us-prices-feb-2022-rcacppi
- (4) https://morningconsult.com/return-to-shopping/
- (5) https://cre.moodysanalytics.com/insights/cre-trends/office-to-apartment-conversions/
- (6) https://www.storagecafe.com/blog/us-renters-migrate-toward-feeder-cities-with-dallas-suburbs-biggest-renter-magnets/
- (7) https://www.mckinsey.com/business-functions/operations/our-insights/bridging-the-labor-mismatch-in-us-construction?cid=soc-web
- (8) https://www.bls.gov/news.release/jolts.nr0.htm
- (9) https://www.rcanalytics.com/chart-us-cross-border-ranks-2015-2021
- (10) https://cre.moodysanalytics.com/insights/cre-trends/tech-markets-to-watch-and-why/

National Overview
THE RETAIL SECTOR was already steeped in transformational shakeout prior to the pandemic, rightsizing to how shopping is done in an increasingly digital economy. In what has already been a decade-long process, most analysts thought it would be a decade more before we started to see a turnaround. Of course, the pandemic has updated those timelines dramatically. SVN® Retail Product Chair Ryan Imbrie, CCIM notes that the retail sector “landed on the unfavorable side of COVID-19’s lopsided impact on commercial real estate.” While industrial properties benefited from the surge in online spending, Imbrie says the pandemic advanced the retail sector’s “long slide” with mounting store closings and rising vacancy.
As the old Winston Churchill quote goes, “If you’re going through hell, keep going.” In 2020, with physical restrictions on retail in place, a significant portion of retailing shifted from in-person to online. E-commerce’s share of retail sales has grown by an average of 0.5 percentage points annually since the start of the millennium, but between Q1 and Q2 2020, it shot up from 11.4% to 15.7%1— quantitative proof that Americans were not only buying toilet paper and DIY arts and crafts during the shutdown. Thankfully for the Retail sector, shoppers returned to the aisles in late 2020 and continued doing so throughout 2021. Through Q4 2021, e-commerce’s share of retail sales has fallen down to 12.9%.2
Overall, monthly retail sales reached their highest level on record in January 2022, coming in at a seasonally adjusted $650 billion for the month.3 The sector “has experienced some bright spots where tenants are thriving as seen in grocery-anchored properties, home improvement, and dollar stores,” remarks Mr. Imbrie. Over the short term, the sector should continue to benefit from an apparent shift away from services and towards the consumption of physical goods that have remained present even as the country has lifted most pandemic-era restrictions.

The Retail sector was often compared to a patient on life support heading into the pandemic, and the shock of the shutdown was widely thought to be a knockout blow. Interventions by the Federal Government, namely the Payroll Protection Program, helped to limit the scale of distress. According to Trepp, levels of distress in the sector continue to improve, though investors remain cautious. Through January 2022, the CMBS delinquency rate has improved to 8% — down from 18% during the pandemic’s crisis peak, though still above the sub-4% level where it was entering 2020.4
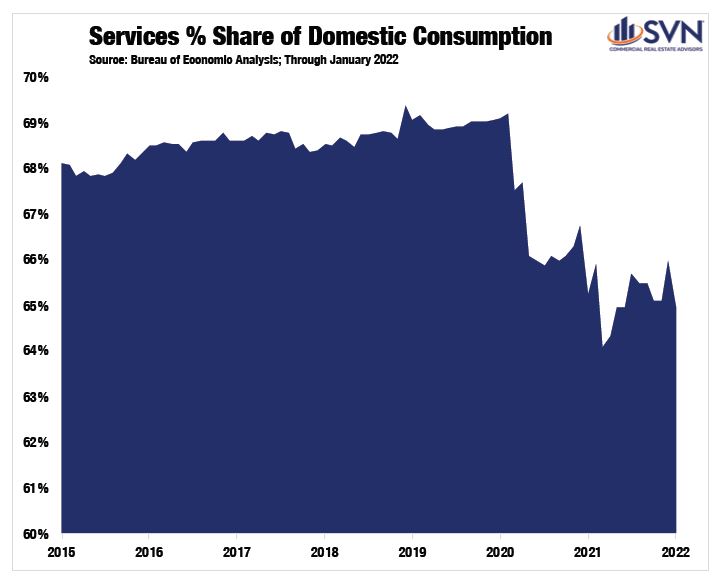
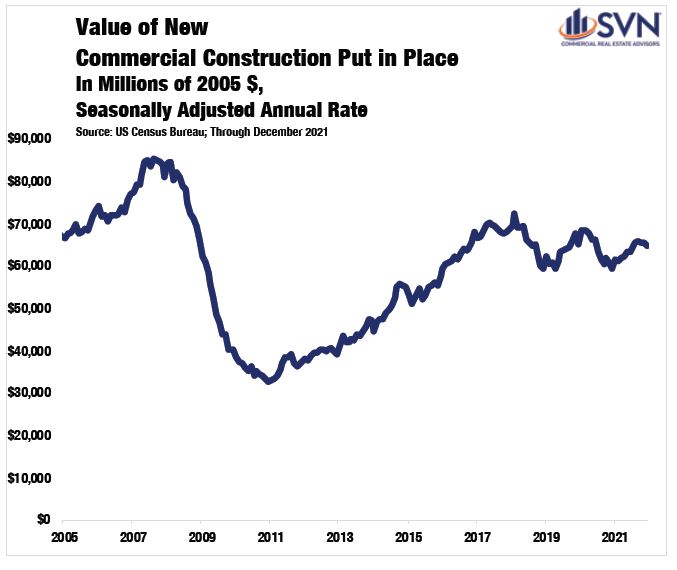
Still, for the first time in a long time, having a healthy dose of optimism for the Retail sector feels appropriate. According to OpenTable’s COVID recovery tracking, the US is arriving right back at its pre-pandemic benchmark for restaurant reservations almost two years after the initial shut down. Moreover, after adjusting for inflation, the value of new commercial construction put in place, a broad category that includes most retail and wholesaling activities, has trended downward since 2018. With less new supply entering the Retail sector, the macro task of repositioning existing stock becomes a bit less herculean. Retail may not be out of the woods just yet, but after following Mr. Churchill’s advice, the temperature dial is starting to improve.
Financial Performance
TRANSACTION VOLUME
Transaction volumes in the retail sector surged in 2021, following a trend observed throughout all commercial real estate. According to Real Capital Analytics, deal volume for retail assets reached $76.8 billion last year — an 88% improvement from 2020’s pandemic-muted total and 14.1% better than 2019’s mark.5 While new deal activity in 2021 remained down from 2015’s record peak by $13.5 billion, last year saw the most retail deal volume since 2018.6
As was the case in 2020, the Retail sector was a mixed bag of outcomes across its sub-property types. Big Box Retail assets saw a resurgence as new deal activity rose by 88% to $2.6B — roughly equivalent to 2019’s and 2020’s totals combined.7 Lifestyle/Power Centers also saw a large uptick in 2021, posting $5.8 billion of deal volume, marking its highest total since 2014.8 Mall assets have continued to see deal volumes crater as the maligned product type posted just $1.9 billion of trades last year, declining 51% from 2020.9 Drug store assets saw muted growth in 2021 as deal volume grew year-over-year by just 19%.10 However, Drug Store’s lackluster (by comparison) growth total is a function of the product type’s success in 2020, as it was the only asset type seeing investment growth during the pandemic slowdown.
CAP RATES AND PRICING
Cap rates for Retail properties continued to post declines in 2021. Through Q4 2021, cap rates are down 6 bps from Q3 and 20 bps from the same time last year.11 Again, retail sub-types saw dramatically idiosyncratic cap rate movements through 2021. Unsurprisingly, Malls were the only sub-asset type to post rising property yields in 2021, growing 47 bps year-over-year through Q4 2021.12 Grocery-anchored followed next, with the property type posting just 11 bps of cap rate compression last year.13 On the other side of the spectrum are Anchored and Big Box retail assets, which posted cap rate compression totals in 2021 of 42 bps and 49 bps, respectively.14
On the pricing front, retail assets across the board saw improving trading valuations in 2021. The average year-over-year price appreciation for all retail assets through Q4 2021 was 24.7%.15 Moreover, retail assets generally are trading at valuations 19.0% above where they stood pre-pandemic and 18.1% above their previous all-time high (2016).16 The best performing retail sub-types by price appreciation in 2021 were Centers and Unanchored assets, which saw valuations grow by 30.5% and 22.6%, respectively.17
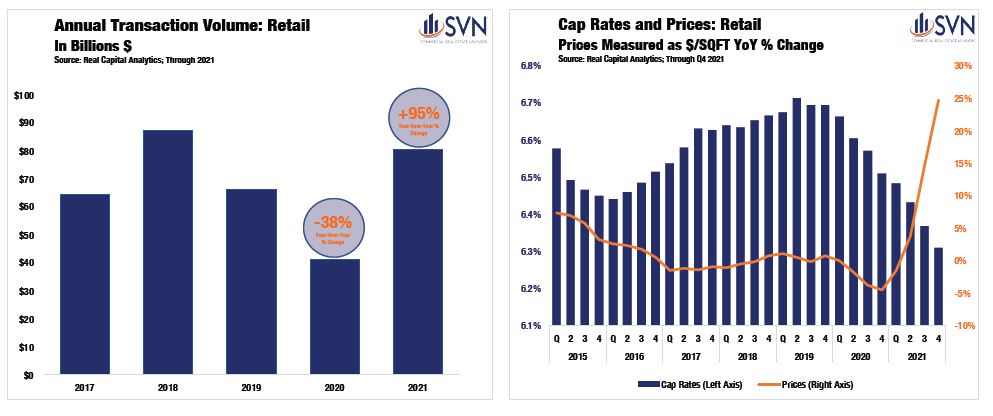
Markets Making Headlines
THE SUNBELT EXPANSION
From the coastlines of Florida to the outskirts of the Colorado River, the retail sector in the Sun Belt is cashing in on consumers migrating into the Southern portion of the country. Positive momentum is stretching across state lines and time zones. Nashville closed out 2021 as one of the nation’s top-performing retail markets, posting the third-highest annual rent growth totals (8.4%).18 While Nashville is heralded as the music capital of the country, its tech sector is singing the sweetest tunes of all. Nashville’s expanding tech base is forecast to double the metro’s employment growth rate in the coming years,19 bringing more residents into the area and putting additional upward pressure on available space. Las Vegas, another entertainment industry heavyweight that has cultivated its tech sector, is experiencing a similar trajectory of success. Retail market rents in Sin City finished up 10.0% to close out 2021, the top mark in the country.20
Three of the four largest increases in Retail occupancy last year were found in the Sun Belt — two of which were in Florida.21 Baton Rouge, LA led the entire country with the largest one-year occupancy rate increase.22 Between Q4 2020 and Q4 2021, occupancy rates in
Baton Rouge jumped from 91.4% to an extremely tight 96.8% — an improvement of 5.4 percentage points.23 Moving down the list, Daytona Beach, FL, posted an occupancy rate improvement of 1.9 percentage points, and Fort Myers, FL, rose by 1.4 percentage points.24 Commenting on the Daytona Beach and Ormond Beach area, Carl Lentz of SVN | Alliance Commercial Real Estate Advisors notes that “explosive residential growth and retail traction along the LPGA corridor have been the primary drivers of the momentum.” While warm winters are a consistent selling point throughout the Sunshine State, Daytona’s retail sector has also benefited from its proximity to the region’s booming blend of suburban amenities, a dominating feature of post-pandemic real-estate growth.
Mr. Lentz goes on to mention that “as local and regional retailers continue to see success, many national retailers are paying attention and entering the market.”
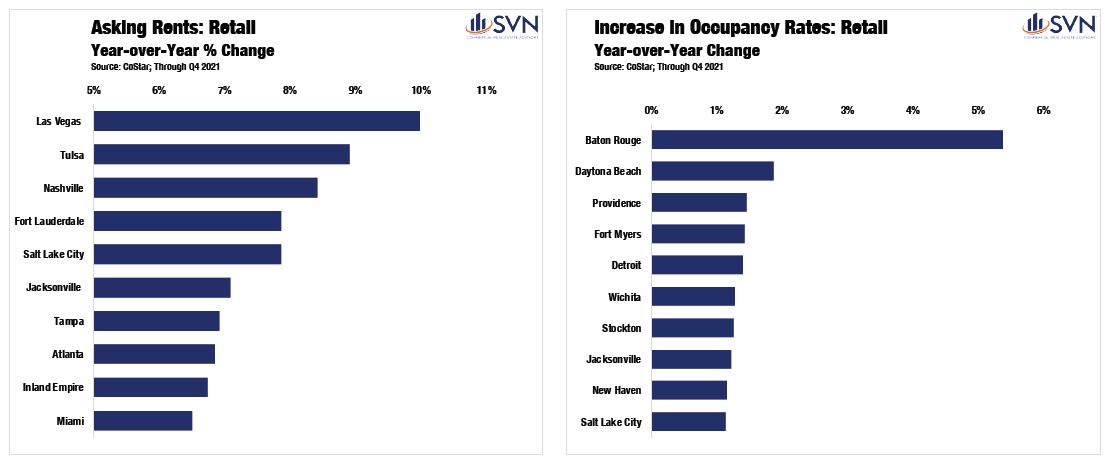
Macro Economy
ECONOMIC GROWTH
The US economy has experienced a robust recovery from the initial shock of COVID-19. A pandemic-driven shift in consumption away from services and into goods, boosted by a sweeping stimulus effort, reconditioned our economy well before an off-ramp from the public health crisis was in sight. By Q3 2020, inflation-adjusted GDP shrugged off its worst quarterly performance on record to record its best, a 33.4% annualized growth rate.1 In 2021, the total nominal value of all consumption and production reached $23.0 trillion, a 9.1% increase above 2020’s total and 6.9% above 2019’s total. After adjusting for inflation, the US economy is 3.2% larger than its pre-pandemic peak.2
The foundation of the economy’s rebound has been a swift labor market recovery. At its April 2020 peak, the official unemployment total reached a staggering 23 million people.3 By the start of 2021, the unemployment total had improved to just 10.1 million people out of work.4 Over the past year, this level has come down to 6.5 million people, less than one million above the pre-pandemic level of 5.7 million.5
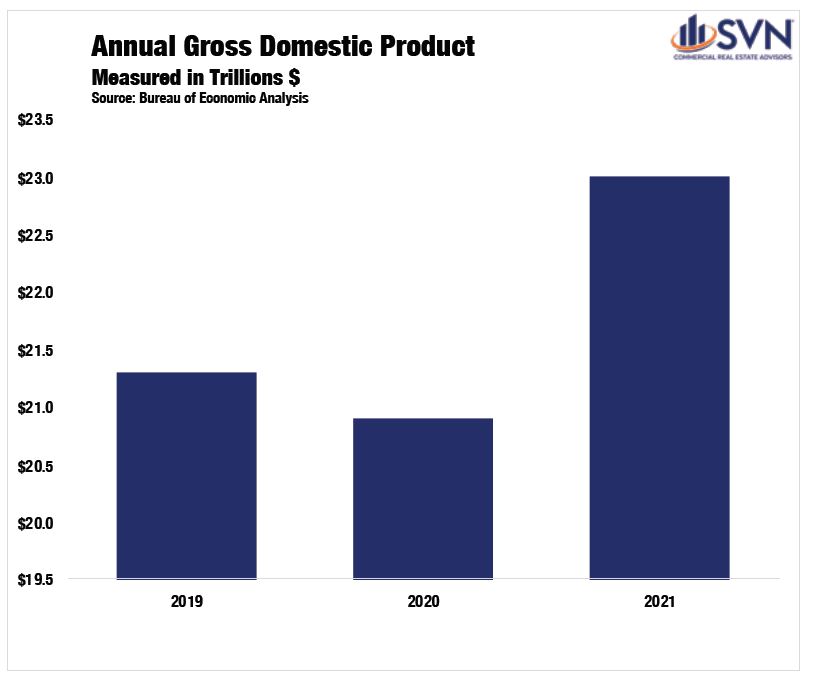
INFLATION & MONETARY POLICY
One year ago, the market consensus was that the Federal Open Market Committee (FOMC) would not begin a monetary policy tightening cycle until 2023. However, as demand surges in the face of gummed-up supply chains, rampant inflation has emerged at center stage, forcing shifting guidance from policymakers.
After decades of tepid price increases, in January 2022, the Consumer Price Index (CPI) reached 7.5%, a level not seen in 40 years.6 Core-PCE, the Federal Reserve’s preferred inflation gauge that excludes food and energy prices, reached 5.2% in January, prompting the FOMC to be increasingly committed to an interest-rate hike at its March 2022 meeting.7 In just 24 months, policymakers at the Federal Reserve have repositioned themselves from a tighter monetary policy stance into an accommodative one and back to a tightening one. According to the CME Fed Watch Tool, as of February 23rd, future markets are forecasting seven rate hikes by the end of the year — a sizable shift from even just one month earlier, when future markets were forecasting just four rate hikes in 2022. Volatile swings in the medium-term outlook are symptomatic of the rapid shifts in economic activity that categorized the past two years.
In December, Fed officials looked on cautiously at the near-term outlook as Omicron emerged as a roadblock to economic normalcy. After the Delta variant led to declining activity and sluggish job growth in mid-to-late summer 2021, some officials worried that Omicron, a more transmissible variant of COVID compared to previous waves, would hinder the recovery. While a significant wave of US cases followed, the Omicron wave proved to be less deadly and less straining on the US public health system than previous ones. As a result, an increasing number of US states and municipalities are relaxing masking and vaccine restrictions. On February 25th, the CDC introduced a new slate of guidelines that experts say shifts the US into the “endemic phase” of the pandemic. The new guidelines would put more than half of US counties and over 70% of the population in “low” or “medium” risk designations, bolstering the FOMC’s willingness to remove accommodative monetary policies.
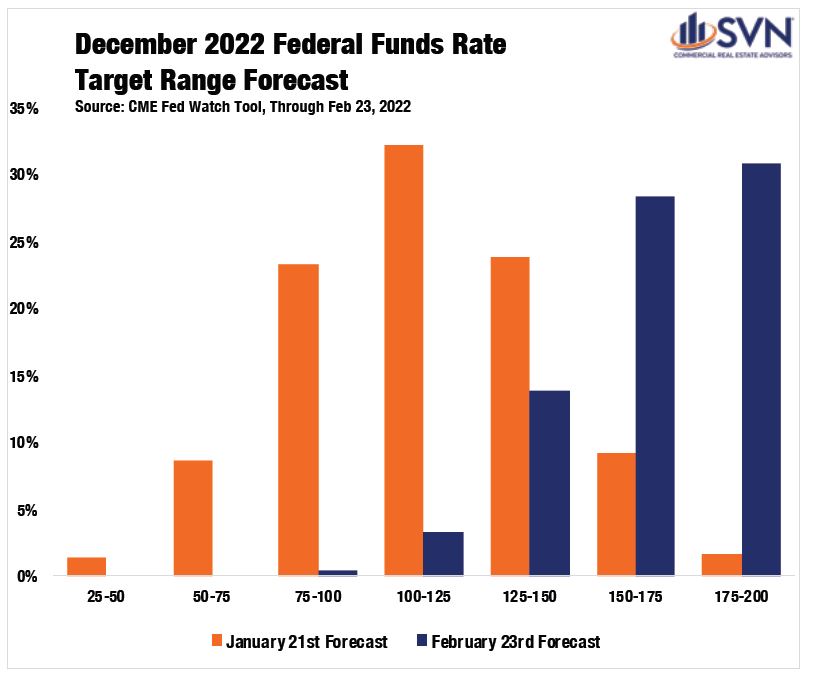
THE GREY AREAS
Still, a measurable dose of uncertainty overhangs stock markets and the whole macroeconomy. The VIX, a volatility index captured by the Chicago Board Options Exchange, has remained stubbornly elevated since the onset of the pandemic. Despite moderately retracting during the fall of 2021, the annual average for the VIX in 2021 was 19.7, 27.7% above its 2019 average.8
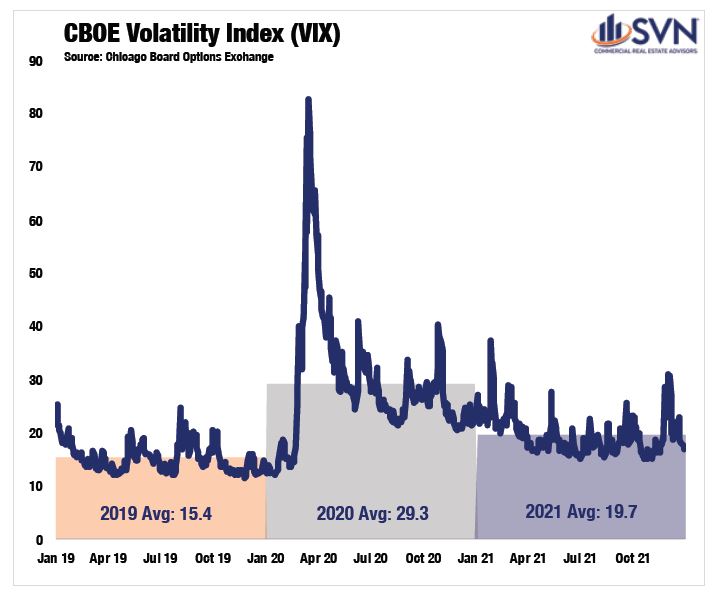
The SVN Vanguard team can help with your retail real estate needs. We can help you find the ideal retail property for sale or lease. Interested in discussing a sale-leaseback? Contact us.
NATIONAL OVERVIEW SOURCES
- US Census Bureau
- US Census Bureau
- US Census Bureau
- https://www.trepp.com/hubfs/Trepp%20Retail%20Report%20February%202022.pdf?hsCtaTracking=8cec15d8-2d6d-4a7e-b3be-47518c19f0f8%7C7edd6f4f-a67b-476b-aaec-43ab495ce73c
- Real Capital Analytics; Through Q4 2021
- Real Capital Analytics; Through Q4 2021
- Real Capital Analytics; Through Q4 2021
- Real Capital Analytics; Through Q4 2021
- Real Capital Analytics; Through Q4 2021
- Real Capital Analytics; Through Q4 202
- Real Capital Analytics; Throughout Q4 2021
- Real Capital Analytics; Throughout Q4 2021
- Real Capital Analytics; Throughout Q4 2021
- Real Capital Analytics; Throughout Q4 2021
- Real Capital Analytics; Throughout Q4 2021
- Real Capital Analytics; Throughout Q4 2021
- Real Capital Analytics; Throughout Q4 2021
- CoStar; Through Q4 2021. Note: Measured across the top-100 markets
- https://technologycouncil.com/wp-content/uploads/2021/11/2021-State-of-Middle-TN-Tech.pdf?utm_source=Sailthru&utm_medium=email&utm_campaign=2021.11.22%20NASH&utm_term=NASHtoday%20Subscribers%20-%20MASTER
- CoStar; Through Q4 2021. Note: Measured across the top-100 markets
- CoStar; Through Q4 2021. Note: Measured across the top-100 markets
- CoStar; Through Q4 2021. Note: Measured across the top-100 markets
- CoStar; Through Q4 2021. Note: Measured across the top-100 markets
- CoStar; Through Q4 2021. Note: Measured across the top-100 markets
MACRO ECONOMY SECTION SOURCES
- US Bureau Economic Analysis
- US Bureau Economic Analysis
- US Bureau Labor Statistics
- US Bureau Labor Statistics
- US Bureau Labor Statistics
- US Bureau Labor Statistics
- US Bureau of Economic Analysis
- Chicago Board Options Exchange


