1. LARGE FUNDS INCREASE CRE FOOTPRINT
- A recent analysis by Reuters details how large funds are increasing their CRE market share as traditional lenders such as banks pull back.
- Stricter capital rules for banks and recent regional bank failures in the US have led to a retreat from traditional lenders in the real estate space, increasing demand for alternative lenders.
- Large firms such as PGIM, LaSalle and Nuveen, and Brookfield, among others, recently expressed their plans to increase their credit exposure to property markets as they bet on an end to the recent decline in real estate prices.
- Logistics, data centers, multifamily apartments, and high-end office properties are garnering the most attention from funds looking to expand their footprint.
2. FORECLOSURES FALL

- According to the latest data tracked by ATTOM, nationwide foreclosure activity fell slightly in April after increasing in March.
- US foreclosure filings, which include default notices, scheduled auctions, or bank repossessions, are down 4.0% month-over-month and an equivalent decline from one year ago.
- Maryland, Illinois, and Nevada posted the highest foreclosure rates in April, while Cleveland, Baltimore, and Chicago posted the highest rates among major US metros.
- To further contextualize the market’s direction, ATTOM’s report shows that foreclosure starts fell by 7.0% during the month while foreclosure completions rose by 8.0%. If the trend holds, foreclosures may remain elevated in the short term before dropping off.
3. LOGISTICS MANAGERS’ INDEX
- Cell phone activity data tracked by the University of Toronto School of Cities show that between March 2023 and March 2024, downtown US and Canadian cities saw a median increase of 9.3% in foot traffic.
- While the findings do not detail the type of places where new activity occurs, they suggest that most downtown areas continue to gradually recover from the pandemic.
- Of the metros tracked, 50 cities have downtown areas experiencing a recovery compared to 14 that are trending downward.
- Notably, the report points out that among the metros trending downward are cities that had previously topped their rankings, suggesting that many of them recovered more quickly.
- The top five metro areas by year-over-year downtown activity growth were Minneapolis (+45.7%), Ottawa (+39.5%), Montreal (+38.6%), Chicago (+36.6%), and Louisville (+31.9%).
4. CMBS DELINQUENCIES SPIKE
- According to Trepp data, the CMBS delinquency rate spiked in April, climbing 40 basis points to 5.07%, its highest rate since September 2021.
- The uptick reversed a slight decrease registered during the previous month and was driven mainly by increases in office, lodging, and retail delinquencies, each experiencing their most significant monthly increases in almost a year.
- Further, over a dozen loans with outstanding balances exceeding $100 million became delinquent during the month.
- Industrial and Multifamily experienced a slight month-over-month decline in delinquencies during April, with each reversing increase in March.
5. RETAIL FOOT TRAFFIC REBOUND
- A recent analysis of data from Forrester suggests that lease negotiations in the Retail real estate sector are occurring at earlier points in advance of lease expirations compared to previous years, shifting the market in favor of landlords and likely a bullish signal for asset prices.
- Offline sales rose by 78.1% in 2022 as nationwide in-person activity rebounded from pandemic lows and remained robust in 2023. Foot traffic in prime trade areas is expected to return to pre-pandemic levels in the third quarter of this year and surpass them in 2025.
- The report notes that several downtown shopping districts continue to be hampered by increased crime rates and declines in office attendance, but rents for prime retail space are up 9% in US markets compared to 4.8% globally.
- Moreover, while online sales have become an increasingly influential part of the overall retail market, the report estimates that brands with a physical location increase their digital sales by an average of 6.9% while closing stores depress sales.
6. CPI INFLATION
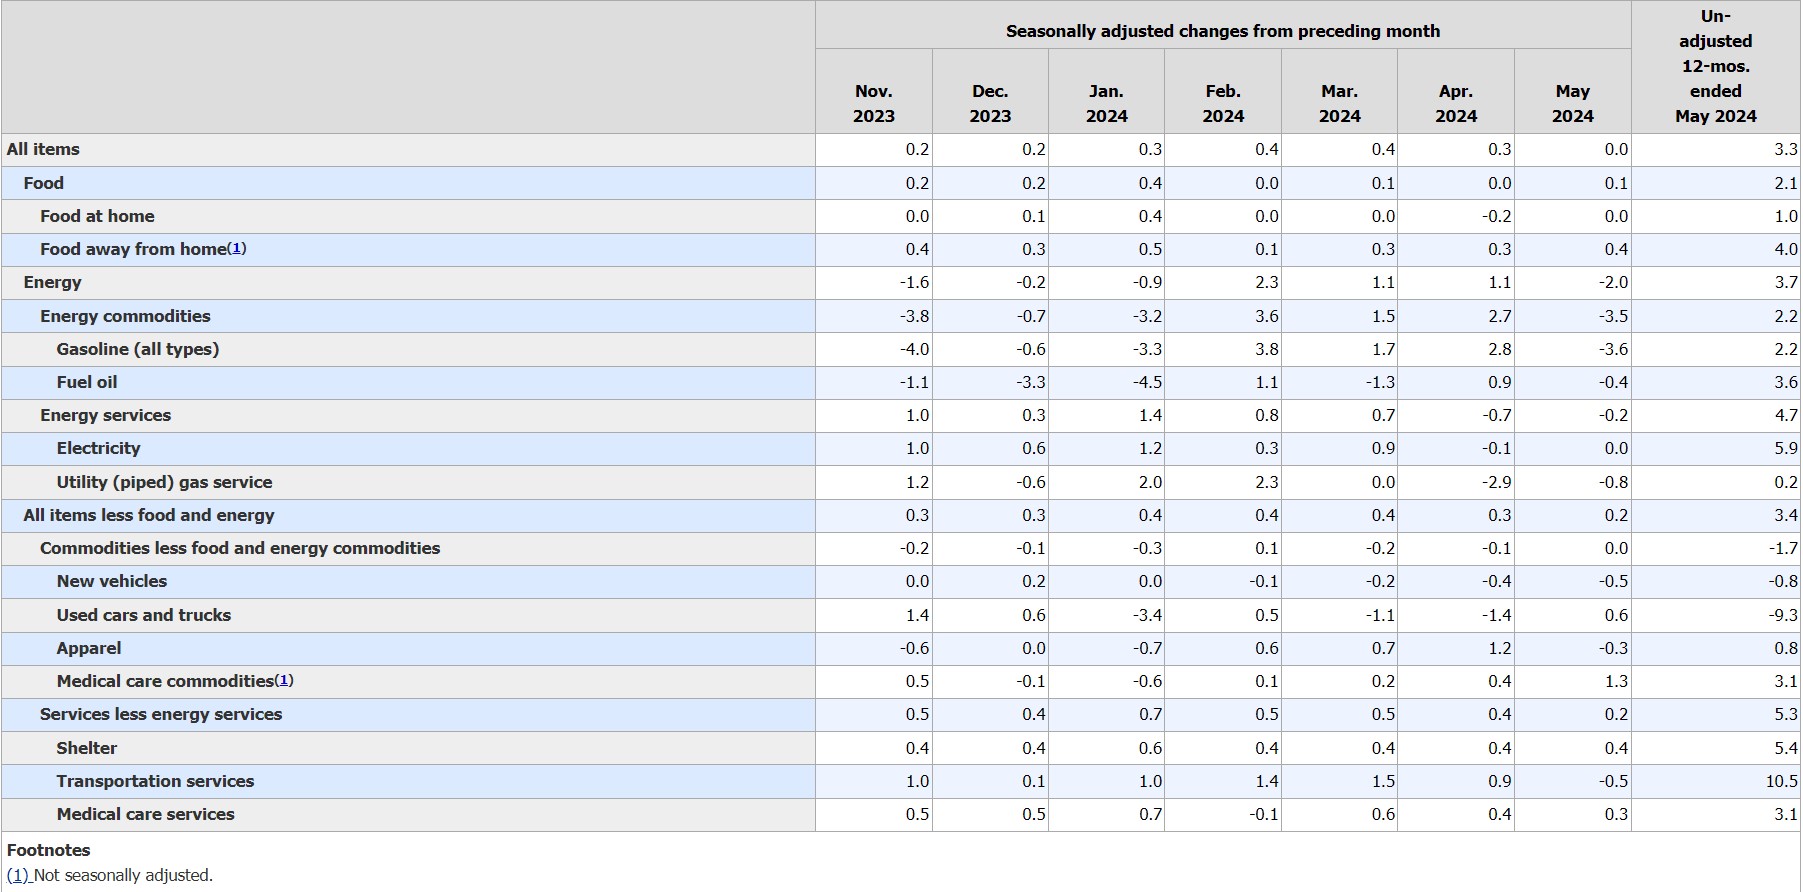
- Inflation, as measured by the Consumer Price Index (CPI), experienced a slight easing in April following three consecutive months of increases or unchanged rates on a monthly basis, according to the latest data from the Bureau of Labor Statistics.
- CPI rose 3.4% over the past 12 months, roughly aligned with expectations. Meanwhile, core inflation rose 3.6% annually, its lowest reading since April 2021.
- While the relief in price pressures will be a welcome sign from Federal Reserve policymakers, inflation in April was primarily driven by rises in shelter and energy.
- Shelter costs have been a critical focus of policymakers, given their significant contribution to price pressures over the past several years. The shelter index of CPI rose by 0.4% month over month and 5.5% year over year, well above the levels needed to drive inflation back down to 2%.
7. REPUBLIC FIRST FAILURE
- According to a recent analysis from Commercial Observer, Republic First’s recent bank failure will have a limited impact on CRE markets.
- The Philadelphia-based bank, which finished 2023 with $5.87 billion in total assets, was shut down by Pennsylvania regulators in April. This renewed concerns over the instability of the banking system that began one year ago following the failures of three regional banks: Silicon Valley Bank, Signature Bank, and First Republic.
- Sam Chandan, director of NYU’s Chen Institute for Global Real Estate Finance, suggests that the failure will have limited impact on real estate portfolios where the bank operated. Still, Chandan notes that the market remains “particularly sensitive to signals of instability” and that recent attention toward the bank failure may be more noteworthy than the failure itself as markets work to “discern whether or not the failure has a bearing on or is relevant to our thinking about broader bank stability.”
- Republic First’s assets and deposits were acquired by Fulton Financial Corp, a Lancaster, PA-based bank, in an action overseen by the FDIC.
8. INTEREST RATES
- The FOMC held interest rates unchanged at its April 30th-May 1st policy meeting, the seventh time in its last eight meetings that it decided to do so. The Federal Funds rate is currently set to 5.25% to 5.5%.
- The decision continues the committee’s “wait-and-see” approach, which has seen Fed policymakers move away from actively raising interest rates and toward a more moderate stance that digests month-to-month inflation dynamics before signaling the direction of rates moving forward.
- The committee’s latest decision to hold comes on the heels of higher-than-expected inflation rates in recent months, including a 3.5% year-over-year uptick in the Consumer Price Index in March.
- Further, recent Q1 GDP data suggests that consumer spending has remained elevated since the start of 2024, potentially sustaining price pressures even as interest rates sit at generational highs.
- At the beginning of this year, consensus estimates predicted three quarter-percent rate cuts in 2024 beginning in March, which have moderated in recent months as Fed officials cautioned against a premature pivot and the US economy continues to expand at an impressive pace. Through May 15th, the majority of futures markets now see just two quarter-percentage points cuts in 2024.
9. APRIL JOBS REPORT
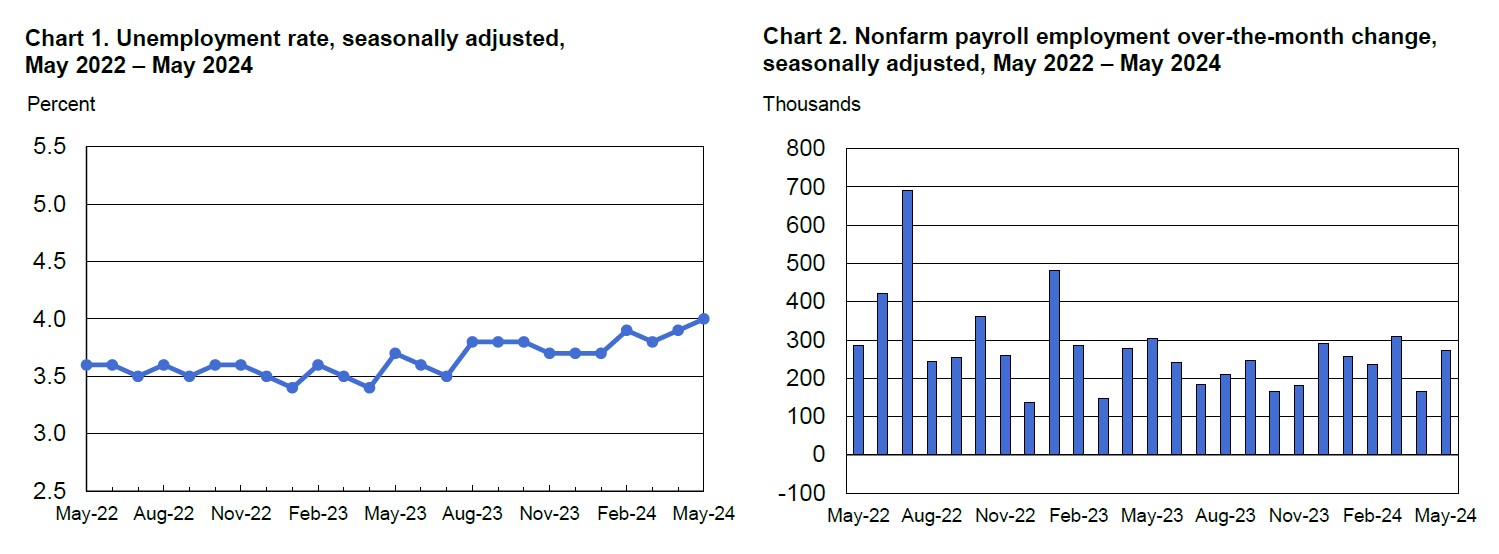
- According to the Bureau of Labor Statistics, nonfarm payrolls rose by 175,000 in April, below consensus estimates, and a significant slowdown in hiring activity was seen at the start of the year.
- April’s job numbers were the slowest pace of hiring in six months and coincided with a ten basis point increase in the unemployment rate to 3.9%. Meanwhile, wage growth eased, with average hourly earnings falling below a 4% annual pace for the first time since June 2021.
- Despite the slowdown in hiring, the US labor market appears to be on solid footing as initial unemployment claims remain at moderate levels.
- April’s slowdown may give the Federal Reserve some breathing room. Officials are monitoring leading indicators such as employment growth in hopes that inflation can return to its longer-run target of 2%.
10. CONSUMER SENTIMENT
- Consumer sentiment fell in May to its lowest level in six months, according to preliminary data from the University of Michigan.
- Both the sub-indices measuring current conditions and expectations declined during the month, with consumers expressing worries that inflation, unemployment, and interest rates may each be heading in an unfavorable direction.
- Inflation expectations for the next twelve months rose to 3.5%, up from 3.2% in April and a six-month high. The five-year inflation outlook also rose to a six-month high at 3.1%.
SUMMARY OF SOURCES

SHAREABLE FLIPBOOK DOWNLOADABLE PDF
1. HOMEBUYERS ADJUSTING TO HIGHER INTEREST RATES
- A new survey by Fannie Mae suggests that home buyers are gradually adjusting to higher mortgage rates despite increasingly negative sentiments about the housing market.
- Fannie Mae’s Home Purchase Sentiment Index dropped in March for the first time since November, primarily driven by mortgage rates that remain near generational highs despite expectations last fall that rate-cute could be on the horizon.
- While the delay of rate cuts is likely fueling pessimism, underneath these data, consumers appear to be recalibrating their expectations around interest rates.
- Data from the survey show that the measurements for questions asking if it’s a “good time to buy” or a “good time to sell” both moved higher, suggesting that the higher rate environment is starting to be seen as a “new normal” by both buyers and sellers.
- Still, while responses moved in a positive direction, most consumers (80%) still say now is a bad time to buy a house. However, this suggests that even a slight reduction in interest rates could bring buyers and sellers off the sidelines.
2. WHY HAVEN’T RATE HIKES REDUCED SPENDING?
- While the Federal Reserve’s interest rate hikes have successfully reigned in borrowing by households and businesses, it has not meaningfully reduced consumer spending or output—the critical mechanism policymakers rely on to calm inflation pressures.
- In a recent analysis, economist Matthew C. Klein suggests that this is explained in part by consumers’ reduced reliance on debt in the aftermath of the Great Financial Crisis (GFC)
- As financers recalibrated their credit standards post-GFC, new spending became increasingly financed by income growth rather than debt reliance relative to before the GFC.
- Incomes have grown rapidly during pandemic and post-pandemic years while balance sheets remain healthy as increasing asset values reduce the strain of rising debt servicing costs.
- Klein points out that today’s spending activity has been financed mainly by more people working and at higher pay rates. This both reduces the potential impact of rising interest rates on consumption levels and suggests that spending levels are sustainable relative to employment.
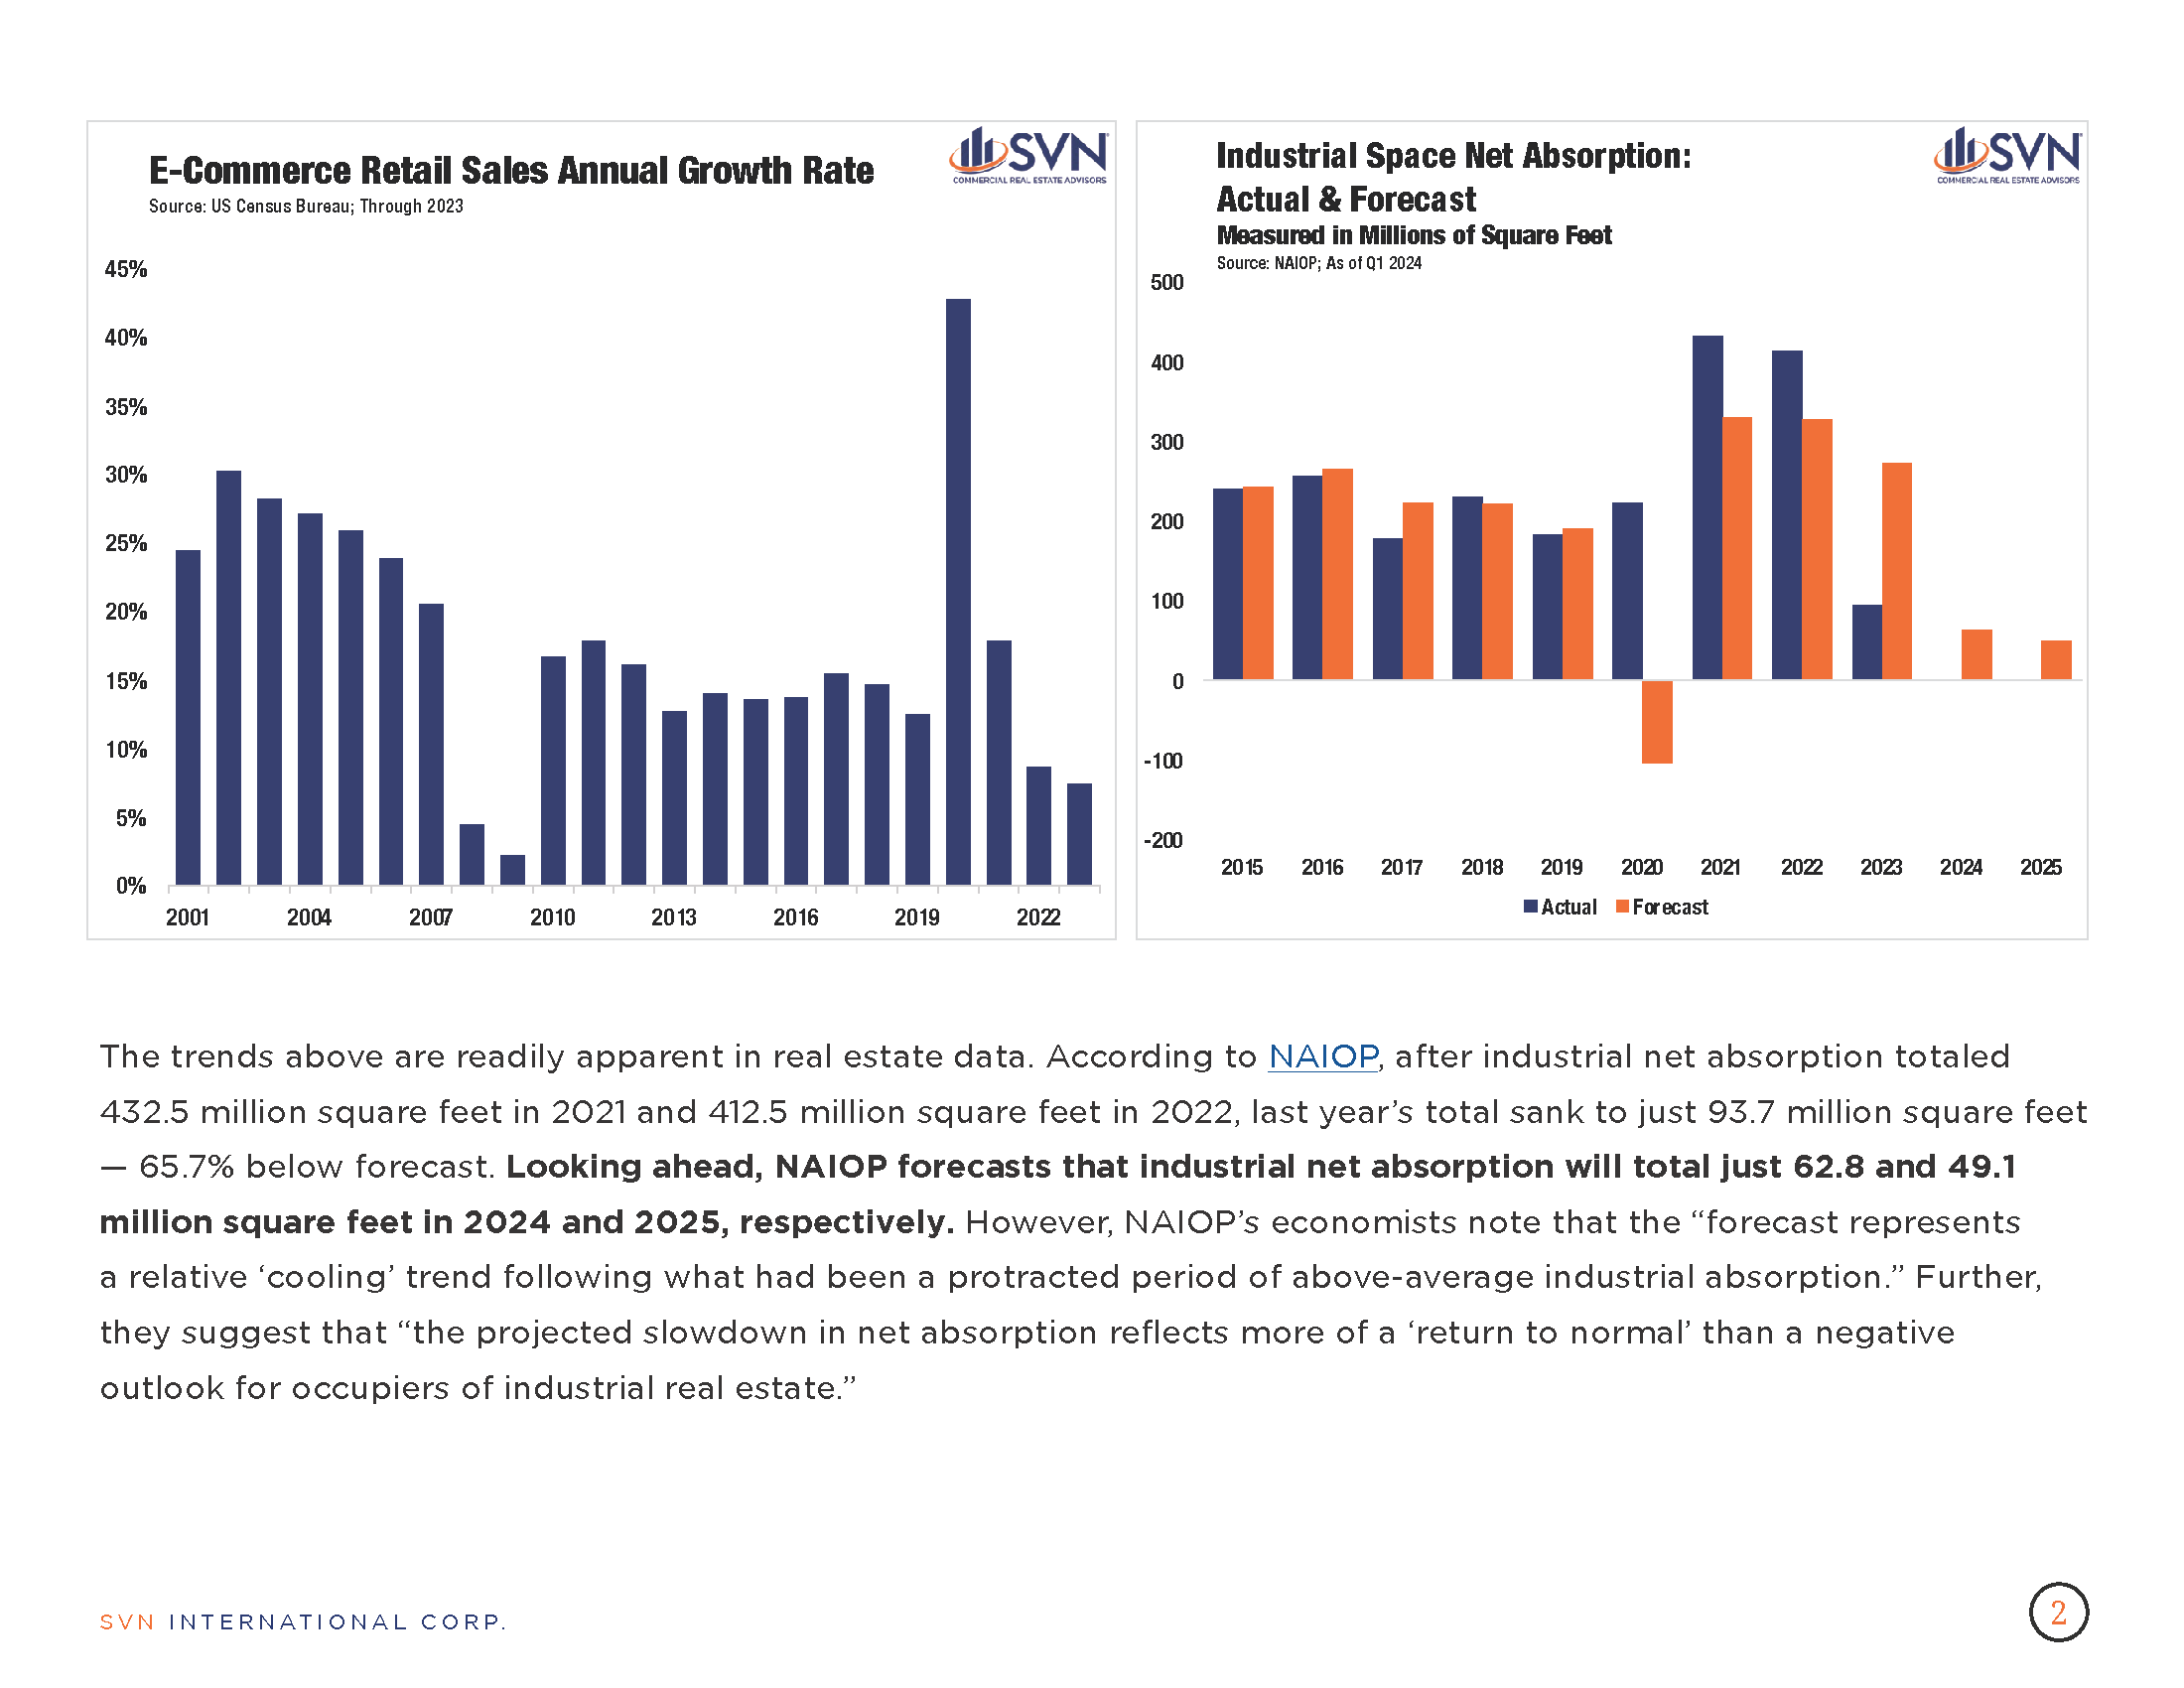
3. LOGISTICS ACTIVITY SURGES, FASTEST IN 19 MONTHS
- According to the Logistics Managers’ Index, US logistics activity experienced its fastest monthly expansion since September 2022 during March, reaching an index level of 58.3.
- While growth levels remain at the lower end, this signals a healthy turnaround for industries that impact warehousing and transportation. According to the report, recent growth is attributed to “long-planned inventory expansions and improved efficiency in warehousing and transportation.”
- An increase in inventory levels drove the overall expansion in the index in March as inventories reached their highest mark since October 2022.
- Consequently, warehouse capacity contracted, its first since January 2023. Absorption of warehouse capacity is a sign of strengthening demand, a bullish signal for the Industrial real estate market.
- Nonetheless, transportation prices continue to outpace capacity, indicating that we may still be in the midst of a freight recession.
- Overall, the analysis notes that recent data suggests that firms are gearing up for a continuation of strong consumer spending levels in the future.
4. HAS OFFICE ACTIVITY REACHED ITS FLOOR?
- A recent Moody’s review of Placer AI data reports that while employee office visits fell by 31.3% between February 2020 and February 2024, they have risen by 18.6% over the past 12 months. Whether or not office activity has reached its floor may have important implications for office valuations.
- In the San Francisco metro, where office buildings have experienced the most extensive post-pandemic drop-in activity (-46%), visits have rebounded by 24% compared to February 2023, the second largest increase nationally, behind Dallas.
- However, when comparing the Placer AI data with their own commercial real estate insights, Moody’s finds that higher visits do not necessarily translate into higher occupancy rates in the short term but do so over more extended periods of analysis.
5. CPI INFLATION
- Consumer prices increased more than expected in March, rising 0.4% from February and 3.5% year-over-year, according to the latest data from the Bureau of Labor Statistics.
- On average, economists surveyed by Dow Jones forecasted monthly and annual inflation rates of 0.3% and 3.5%, respectively. Futures markets fell following the report while US Treasury yields rose.
- The core Consumer Price Index (CPI), which excludes food and energy, also rose by 0.4% in the month but accelerated faster than headline CPI on an annual basis, increasing by 3.8% from one year ago.
- Shelter costs rose 0.4% from February and 5.7% year-over-year. The Shelter component of CPI has been one of the most stubborn sources of inflation pressures throughout the post-pandemic period. Fed policymakers are keen to see shelter cost pressures decelerate before moving forward with a policy pivot.
6. FOMC MEETING MINUTES
- Minutes from the FOMC’s March policy meeting reflect that officials remain cautious about the timing of a potential policy pivot, noting that inflation rates weren’t moving lower quickly enough.
- The committee held the benchmark federal funds rate unchanged at its latest meeting in March, continuing its wait-and-see approach regarding any decision to begin rate cuts.
- Comparing language from the March meeting minutes with those from the previous meeting in January, officials again expressed that they need to have “gained greater confidence” that inflation was on a path towards their 2% targeting before cutting rates.
- At the time of the meeting, the US economy had come off of back-to-back higher-than-expected inflation readings in January and February. Since the Fed’s March meeting, consumer prices have again charted higher than estimates suggested, validating officials’ concerns about recent trends.
- Officials also cited geopolitical turmoil and rising energy prices as persisting inflation risks.
7. SUMMARY OF ECONOMIC PROJECTIONS
- In The FOMC’s latest Summary of Economic Projections, policymakers kept the end-of-year federal funds and PCE inflation rate forecasts constant. Still, they shifted their projections on 2024 growth, the year-end unemployment rate, and core inflation rates.
- FOMC officials project that the federal funds rate will fall to 4.6% by year’s end, which aligns with December’s forecast. The current federal funds rate stands at 525-550 and would require three quarter-rate cuts in 2024 to reach the committee’s projection by the end of the year.
- Helping explain the static interest rate forecast is a similarly unchanged projection for headline inflation, which the committee expects to fall to an annual rate of 2.4% by the end of the year.
- However, policymakers have become slightly more hawkish on core inflation since their last projections to close 2023. In the latest reading, projections for core-PCE were raised from 2.4% to 2.6%.
- Higher economic growth forecasts help explain the uptick in core-rate projections—projections for real GDP at the end of 2024 are up from 1.4% to 2.4%. Consequently, officials expect the unemployment rate to fall more steeply this year, revising their projection down by ten basis points to 4.0%.
8. CONSTRUCTION SPENDING
- According to data from the US Census Bureau, construction spending fell by 0.3% month-over-month and increased by 10.6% annually in February, the latest reporting month.
- The drop follows a 0.2% decline in January and surprised forecasters who projected a 0.7% increase during the month.
- The decline was led by a 1.2% fall in public construction spending, while private construction spending was mostly unchanged.
- Within private construction, the residential segment rose 0.7%, but this was offset by a 0.9% decline in nonresidential construction spending.
9. MARCH JOBS REPORT
- Job growth soared past economists’ consensus expectations in March as employers added 303,000 new positions, the largest monthly tally since May last year.
- The historic post-pandemic trend in US job growth has defied many expectations, with many who thought that by now, the pandemic recovery would be finished and job growth would have slowed to its pre-pandemic trend.
- Nonetheless, the US labor market has remained resilient amid 11 interest-rate hikes and stubbornly elevated inflation. The unemployment rate ticked down ten basis points to 3.8% in March.
- Annual wage growth softened from 4.3% in February to 4.1% in March. The trend will be welcomed by Federal Reserve policymakers looking for a decline in inflation’s leading indicators, of which employee wages constitute a significant part.
10. BLACKSTONE GOES ON INVESTMENT “OFFENSIVE”
- The Wall Street Journal (WSJ) recently reported on a deal by Blackstone to purchase Apartment Income REIT (AIR Communities) for upwards of $10 billion.
- The deal is significant in that it is the largest Multifamily market transaction in the firm’s history and reflects bullish sentiments by larger firms on commercial real estate more broadly.
- In addition to positive investment sentiment about the rental housing market, the report suggests that Blackstone believes that commercial real estate may be reaching its cyclical floor, making now a good time to buy.
- Referencing data from Commercial Mortgage Alert, WSJ notes that while real estate transaction activity has cratered in the past year, CMBS issuance during Q1 2024 was roughly three times (3x) the volume in Q1 2023. Remerging bullishness in the CMBS market could indicate an improving outlook for the broader financing market. Still, much depends on the future path of interest rates.
SUMMARY OF SOURCES
- (1) https://www.investopedia.com/us-economy-news-today-april-8-8628199#toc-2024-04-08t182001942z
- (2) https://substack.com/@matthewcklein?utm_source=substack&utm_medium=email
- (3) https://www.the-lmi.com/
- (4)https://cre.moodysanalytics.com/insights/cre-news/relationship-between-office-visits-and-occupancy/
- (5) https://www.bls.gov/news.release/cpi.nr0.htm
- (6) https://www.federalreserve.gov/newsevents/pressreleases/monetary20240320a.htm
- (7) https://www.federalreserve.gov/monetarypolicy/fomcprojtabl20240320.htm
- (8) https://www.census.gov/construction/c30/c30index.html
- (9) https://www.bls.gov/news.release/pdf/empsit.pdf\
- (10) https://www.wsj.com/real-estate/blackstone-making-10-billion-multifamily-purchase-going-on-the-real-estate-offensive-f3126928


1. CURRENT ECONOMIC CONDITIONS (BEIGE BOOK)
- According to the March 6th, 2024, release of the Federal Reserve’s Beige Book, national economic activity increased over the previous six-week period.
- Eight of the twelve Federal Reserve districts reported slight to modest growth; three indicated soft growth, while one indicated a slight softening of growth.
- Consumer spending ticked down in recent weeks, led by a decline in the sale of retail goods. Further, consumers appear more price-sensitive and have shifted spending away from discretionary goods.
- Air travel was robust during the six-week period, while demand for restaurants, hotels, and other establishments softened as prices entered a seasonal uptick.
- Manufacturing activity was little changed while supply bottlenecks normalized. Delivery delays for electrical components and ongoing disruptions to the Red Sea and Panama Canal shipping continue but have generally not impacted domestic businesses during the reporting period.
- Demand for residential real estate rose during the period as mortgage rates moderated slightly. Commercial real estate activity was comparatively weak, though new demand for data centers, industrial and manufacturing spaces, and large infrastructure projects was notably robust.
2. CRE MARKET SENTIMENT
- A recent market sentiment survey from Bisnow/CohnReznick on CRE operators’ focus for 2024 covered industry viewpoints on capital markets, asset classes, geography, and operational outlook.
- A majority of respondents (41%) expect to deploy both equity and debt over the next 1-2 years—37.5% plan to finance mostly with debt, while 21.9% plan to finance with equity.
- According to the report, equity capital availability remains high, but winning and approving deals remain challenging. Private liquidity is plentiful, but matching investor preferences and yield opportunity remains challenging.
- Asset class sentiment is in line with the prevailing story, with multifamily and industrial dominating investor attention while the retail and hotel landscape remain favorable by most metrics. Office deals are getting done with much market-by-market variation, while high-quality build-to-rent developments continue to draw investor activity.
- Southeast markets continue to lead the charge nationally, particularly in South Florida, North Carolina, and the Nashville metro.
- Operationally, many CRE operators’ concerns centered around technological hurdles such as analytics and reporting, cybersecurity, and privacy.
3. WHITE HOUSE EFFORTS TO SUPPORT MANUFACTURED HOUSING
- In its recent press release, the White House announced new efforts to construct more residential units and lower housing costs, with a focus on manufactured housing.
- The administration plans to release $225 in funding to create and preserve manufactured housing communities. The Department of Housing and Urban Development (HUD) recently opened applications for grants to support the effort.
- A new FHA program will also be established to support the manufactured housing sector through financing, including increasing Title 1 Manufactured Housing program loan limits.
- According to a Bisnow analysis, demand for manufactured homes has skyrocketed since the pandemic. Nearly 22 million Americans now live in manufactured homes, and new shipments increased from roughly 94k in 202 to 113k in 2022.
4. SHIFTS IN INTEREST RATE FORECASTS
- Uncertainty surrounding US growth, labor markets, and inflation has complicated rate forecasts in recent weeks and recalibrated futures markets into a more hawkish stance than at the start of the year.
- Entering 2024, there was a near-uniform consensus (88.5%) that the FOMC would issue its first rate cut at its March policy meeting. Expectations have greatly adjusted over the past two months, and as of March 14th, futures markets place the likelihood of a March rate cut at just 1.0%.
- Stronger-than-expected labor market data over the past two months and signs that its effect on consumer demand remains robust have induced the hawkish U-turn. During Q4 2023, real US GDP increased at a 3.2% annual pace, while estimates from the Atlanta Fed’s GDPNowcast forecast that the economy will grow at a 2.3% annual pace in Q1 2024.
5. FEBRUARY JOBS REPORT
- According to the Bureau of Labor Statistics (BLS), the US economy added 275,000 jobs in February, beating estimates for the second consecutive month. Still, some labor market observers note that other indicators have signaled a cooling in market activity.
- The unemployment rate rose 20 basis points to 3.9% during the month, its highest rate since January 2022. Initial jobless claims have consistently beat estimates in recent weeks while wage growth has also slowed, a strong indicator of both labor market loosening and underlying inflation pressures. Further, the number of job openings per unemployed persons continues to decline.
- A sharp increase in construction, retail, and food service jobs propelled the higher-than-expected gain during the month while industries that more typically lead the charge, such as health care, leisure and hospitality, and government, continued to post the most significant monthly increases.
- The mixed signals emanating from February’s jobs report are testament to the difficult decisions facing the Federal Reserve ahead: the labor market appears to be moderating, but policymakers need more consistent data to move forward with a shift in interest rate policy.
6. CONSUMER SENTIMENT
- According to the latest estimate, the University of Michigan’s consumer sentiment edged lower in February to 76.9 from 79.0 in January. This largely signals that sentiment has held relatively steady in recent months, as the previous three marks for the index have coalesced around this level.
- Expected business conditions are significantly higher than in the fall of 2023, and all components of the index except for one have exceeded their mid-2021 levels, when, notably, pandemic-reopening efforts boosted sentiment numbers.
- Year-ahead inflation expectations edged higher from an expected 2.9% annual inflation rate to an expected 3.0% annual inflation rate. The subtle shift aligns with broader market forecasts over the past month that have moderated the dovish view that price pressures are behind us and rate cuts are imminent.
- Nonetheless, according to the survey’s analysis, shorter run inflation expectations have fallen to the 2.3%- 3.0% range last experienced between 2018 and 2019.
7. FED’S WALLER DOWNPLAYS CRE CRISIS
- In a late February statement, Federal Reserve Governor Christopher Waller said that while risk in commercial real estate is a concern, distress is emerging gradually and is unlikely to cause a crisis.
- Equity cushions could be substantial enough to bear the brunt of potential losses, while according to Paul Fiorilla of Yardi Matrix, the timeline for this development could take 2 to 3 years.
- Waller described the state of market risks as “predictable” and “manageable” and that banks have been preparing for losses, limiting system exposure to potential losses.
8. SPECIAL SERVICING RATES INCREASINGLY DIVERGE
- CMBS Special servicing rates climbed in January to 6.35% after falling slightly in December. It is the highest mark for the CMBS market since October 2021. However, property type performance remains increasingly mixed.
- Most sectors either sustained or amplified emerging trends, furthering the bifurcation of market performance.
- For example, special serving in the multifamily sector dropped sharply in January following more tepid declines to close to 2023. Similarly, following smaller increases in the prior months the office sector rate increased by 129 points. Altogether, three property types experienced absolute changes of 80 bps or more during the month.
9. CPI INFLATION
- According to the latest update from the Bureau of Labor Statistics, consumer prices rose by 0.4% in February and 3.2% over the past 12 months.
- The core Consumer Price Index (CPI), which excludes the more volatile measures of food and energy, also rose 0.4% monthly while charting a slightly higher 3.8% year-over-year.
- Energy and shelter price increases accounted for more than 60% of the total gain in headline CPI as gasoline jumped 3.8% on the month while the shelter measure increased by 0.4%.
- February’s CPI report could serve as hawkish fodder for policymakers who are concerned that, despite the reduction of price pressures, inflation remains above the Fed’s 2% annual target.
10. EXEMPTING AFFORDABLE HOUSING FROM BOND VOLUME CAPS
- The Federation of American Scientists (FAS) recently looked into the potential for exempting affordable housing projects from volume caps on tax-exempt Private Activity Bonds (PABs).
- The FAS argues that PABs are one of the primary financial tools for building and preserving affordable housing due to their relation to LIHTC financing. It says that lifting caps could speed up the development of badly needed housing.
- Their analysis showed that in 2020, 88% of PAB issuance went to multi- and single-family housing, continuing a decades-long upward trend as affordable housing demand climbs.
- Currently, exceptions exist for activities that contribute to public good, such as critical infrastructure project.
SUMMARY OF SOURCES
- (1) https://www.federalreserve.gov/monetarypolicy/beigebook202402-summary.htm
- (2) https://www.bisnow.com/national/news/capital-markets/asset-classes-markets-operational-concerns-bisnow-survey-reveals-cre-focus-for-2024-122095?utm_source=outbound_pub_5&utm_campaign=outbound_issue_75125&utm_content=email_mbr_new-york_text-3&utm_medium=email
- (3) https://www.whitehouse.gov/briefing-room/statements-releases/2024/02/29/fact-sheet-biden-harris-administration-announces-new-actions-to-boost-housing-supply-and-lower-housing-costs/
- (4) https://www.cmegroup.com/markets/interest-rates/cme-fedwatch-tool.html
- (5) https://www.bls.gov/news.release/empsit.nr0.htm
- 6) http://www.sca.isr.umich.edu/
- (7) https://www.nasdaq.com/articles/feds-waller-sees-no-crisis-from-commercial-real-estate
- (8) https://www.trepp.com/instantly-access-january-2024-special-servicing-report?utm_campaign=January%202024%20Special%20Servicing%20Report&utm_medium=email&_hsmi=295088401&_hsenc=p2ANqtz-_uIc1FveREq2CivH0eF3reGTDjbpOyBhGBLR7RPStyIGqwliXmHxn9oe4vscwf-2MuG8VlYSi_ZQVsUbXsSZGY9X_BUg&utm_content=295088401&utm_source=hs_email
- (9) https://www.bls.gov/news.release/cpi.nr0.htm
- (10) https://fas.org/publication/exempt-affordable-housing-from-volume-caps/
1. FOMC INTEREST RATE DECISION
- The FOMC left its benchmark federal funds rate unchanged at its January policy meeting as improving inflation and consumer expectations data has reduced the committee’s need to continue its monetary tightening. Still, the timing of potential rate cuts in 2024 remains uncertain as officials grapple with the complexity of domestic and global economic risks.
- As the inflation picture continued to improve to close 2023, markets increasingly forecasted several Fed rate cuts in 2024. By the final trading day in December, fed futures markets assigned a 74% probability for a March rate cut. However, recent statements of caution by Fed officials and increased global economic uncertainty— notably attacks on commercial shipping in the Red Sea—have made futures markets more hawkish. Currently, fed futures markets forecast an 81.5% probability that rates stay unchanged in March.
- Still, dovish sentiment in the market isn’t unfounded. While the unemployment rate has returned to pre-pandemic levels, it has slowly increased over the past 12 months, with layoffs recently appearing to pick up steam. Over the past few weeks, several notable companies, particularly in the tech and media space, have announced significant layoffs. Initial jobless claims have not seen a meaningful uptick, but quits have declined— evidence of a weakening labor market.
- FOMC members will likely move cautiously through their subsequent interest rate decisions as they weigh these developments and digest incoming inflation data.
2. SENIOR LOAN OFFICER OPINION SURVEY
- In January, the Federal Reserve released its quarterly Senior Loan Officer Opinion Survey on Bank Lending Practices (SLOOS), which reflected tighter lending standards and weakening demand across several loan types compared to the previous quarter.
- Respondents reported tightening standards and weaker loan demand to commercial and industrial businesses of all sizes, while the commercial and real estate loan market experienced a similar contraction.
- Residential real estate loans of all categories except governmental residential mortgages and government-sponsored enterprise-eligible mortgages saw standards tighten. Banks also reported weaker demand for home-equity lines of credit, while consumer loans, including credit cards and auto loans, also saw tightening standards alongside weakening demand.
3. MORTGAGE RATES AND APPLICATIONS
- According to data from the Mortgage Bankers Association, the average contract on a 30-year fixed-rate mortgage (on balances $726k or less) rose slightly to 6.8% during the week ending on February 2nd, 2024.
- Rates stand at their highest in four weeks but below the 23-year peak of 7.9% in October.
- Despite the uptick, mortgage applications climbed 3.7% during the same week, following a 7.2% decline the previous week.
- Refinance applications accelerated further, rising by 12.6% following a 1.6% increase during the last week of January. Conversely, new home applications dropped 60 basis points week-over-week following an 11.4% decline during the previous week.
4. 2024 HOUSING MARKET PREDICTIONS
- An article by Forbes advisor noted that while mortgage rates have improved in recent months, home affordability will likely remain a pressing challenge in 2024 as prices remain sticky and housing supply struggles to catch up to demand.
- Many would-be homebuyers were stuck on the sideline in 2023 as borrowing rates surged and existing owners in older, fixed, low-rate mortgages were less inclined to sell at lower prices.
- Experts expect conditions to improve in 2024, forecasting a busier spring home buying season this year compared to last. However, rates are unlikely to return to pre-pandemic levels, which is likely to keep the issue of existing owners “locked in” at lower rates a salient problem for the purchase market.
- According to Jiayi Xu, an economist at Realtor.com, roughly two-thirds of all outstanding residential mortgages have rates below 4%, making it challenging for the housing market to thaw significantly if rates remain north of this range.
- Nonetheless, experts expect that some reduction from today’s 6-7% range will induce higher transaction volume as demand rises, recharging upward pressure on home prices and incentivizing would-be sellers back into the market.
5. HOUSEHOLD DEBT
- According to the Federal Reserve Bank of New York, consumer debt in the US climbed precipitously during the fourth quarter of 2023, rising by $212 billion or 1.2$% from the previous quarter to $17.5 trillion—a new all-time high.
- Mortgage balances rose by $112 billion, followed by credit card balances (+50 billion) and auto loan balances ($12 billion).
- Other balances, including retail cards and other consumer loans, rose by a combined $25 billion, while student loan balances remained relatively unchanged.
- Delinquency rates were higher compared to the third quarter, climbing to 3.1% of all outstanding debt—an uptick of 10 basis points. However, delinquency rates remain below pre-pandemic levels, suggesting that inflation may be causing rising debt levels to appear more severe than reality.
6. JANUARY JOBS REPORT
- According to the Bureau of Labor Statistics, the US economy added 353,000 new jobs in January, while the unemployment rate was unchanged at 3.7%.
- Both metrics point to continued resilience in the labor market amid inflation pressures and interest rate increases, which may further complicate rate-cut considerations in the near term.
- Professional and business services led all sectors with 77,000 job adds, followed by healthcare (+70,000), retail trade (+45,000), and social assistance (+30,000).
- Declines were led by the mining, quarrying, and oil and gas extraction industry (-5,000), which, conversely, saw little net change during 2023.
- Employment changed little in major industries such as construction, wholesale trade, transportation and warehousing, financial activities, leisure and hospitality, and other services.
7. JOB OPENINGS AND LABOR TURNOVER
- According to the Bureau of Labor Statistics, the number of job openings in the United States changed little in December, charting at 9.0 million on the last business day of December.
- Total hires and separations were also little changed at 5.6 million and 5.4 million, respectively. Quits and layoffs saw little movement compared to the previous month, registering 3.4 million and 1.6 million, respectively.
- Job openings increased at a faster rate for establishments with 5,000 or more employees, while those with 1-9 employees and 10 to 49 employees saw little change.
- On a state level, job openings were up in 2 states (Illinois and Colorado) and down in 4 (Mississippi, Florida, Georgia, and Tennessee), while little changed across all other states and the District of Columbia.
8. LOGISTICS MANAGERS INDEX
- The US Logistics Managers Index increased in January to its highest level in three months and, for the first time since September, has seen each sub-metric of its index expand, according to the report.
- The expansion of the index was led by an increase in inventories, particularly activity by retailers who began to restock in January following the holiday season. Resultingly, inventory costs expanded considerably, while transportation costs rose for the first time since June 2022.
- Warehouse activity rose but at a slower pace, with expansion in both warehousing capacity and utilization.
- The report authors note that while January’s uptick is a strong signal, seasonality factors remain at play, requiring additional months of data before concluding that the logistics industry is returning to a period of growth.
9. CONSTRUCTION SPENDING
- According to the US Census Bureau, US construction spending climbed by 0.9% month-over-month in December, in line with November’s revised measurement and exceeding market estimates.
- Over the 12 months ending in December, total construction spending rose by 13.7%, while total construction value in 2023 was 7% above 2022 levels.
- Private construction spending grew by 0.7% in December, primarily driven by a 1.4% increase in residential sector spending, particularly single-family homes. Meanwhile, the non-residential declined by 0.2%. Public spending rose by 1.3% compared to November.
10. UNITED STATES ECONOMIC OPTIMISM INDEX
- According to the Real Clear Markets/TIPP Economic Optimism Index, sentiment fell in February compared to the previous month and registered below the consensus forecast.
- The index segments measuring respondents’ personal financial outlooks and confidence in Federal Economic Policies declined from January. Meanwhile, the index’s six-month economic outlook segment improved compared to last month.
- Investor optimism fell while it gained among non-investors, with investors experiencing a stronger directional movement in sentiment than non-investors.
SUMMARY OF SOURCES
- (1) https://www.federalreserve.gov/newsevents/pressreleases/monetary20240131a.htm
- (2) https://www.federalreserve.gov/data/sloos/sloos-202401.htm
- (3) https://www.mba.org/news-and-research/newsroom/news/2024/02/07/mortgage-applications-increase-in-latest-mba-weekly-survey
- (4)https://www.forbes.com/advisor/mortgages/real-estate/housing-market-predictions/
- (5) https://www.newyorkfed.org/microeconomics/hhdc
- (6) https://www.bls.gov/news.release/empsit.nr0.htm
- (7) https://www.bls.gov/news.release/jltst.nr0.htm
- (8) https://www.the-lmi.com/
- (9) https://www.census.gov/construction/c30/c30index.html
- (10) https://www.realclearmarkets.com/articles/2024/02/06/rcmtipp_economic_optimism_index_weakens_slightly_1009767.html
The SVN Vanguard team can help with your Commercial Real Estate needs. We can help you find the ideal commercial property for sale or lease. Interested in discussing on Buying or Leasing Office Space? Contact us.
1. DECEMBER JOBS REPORT
- US nonfarm payrolls increased by 216,000 in December, above November’s growth of 173,000 jobs and exceeding the consensus estimate of 170,000 according to the Census Bureau’s latest employment report.
- Meanwhile, initial jobless claims fell during the final week of 2023, indicating that the US labor market remains tighter than some projected. Still, claims data in the upcoming weeks will help us understand how much of an impact holiday season hiring is having on current performance.
- Government jobs grew by 52,000 during the month, while the Leisure and hospitality sector continues to lead private employment growth, adding 59,000 jobs in December, followed by Education and Health Services (+42,000), and construction (+24,000)
2. FOMC MEETING MINUTES
- Minutes from the FOMC’s December meeting show that officials have reached consensus that rate-cuts are likely to come in 2024 but refrained from providing a more specific window for them to occur.
- Officials held the federal funds rate steady at 5.25 to 5.50% at their December policy meeting and indicated that they expect three 25 basis-point cuts by the end of 2024 in their most recent economic projections.
- While on average, FOMC members have a sense that the Fed’s tightening cycle has reached its peak, they continue to stress that their actual policy path forward will depend on how the economy continues to evolve.
- Officials noted an “unusually elevated degree of uncertainty” about the upcoming policy path, with some indicating that it may be necessary to keep the benchmark federal funds rate elevated if inflation doesn’t decelerate as expected, while others haft left the door open for additional hikes if conditions call for them.
3. HOMEBUYERS’ MONTHLY PAYMENTS DROP
- The median housing payment in the US is down by roughly $400 (-14%) from its October 2023 peak, enticing some would-be buyers back into the fray, according to a recent analysis by Redfin.
- The decline in payments coincides with a slow but steady drop in the weekly average mortgage rate, which propelled Redfin’s Demand Index up by 10% between November and December.
- New listings also finished 2023 up by 10% over the end of 2022. The report notes that as mortgage rates thaw, homebuying demand should rise as buyers take advantage of more choices alongside better financial conditions. Meanwhile, pending sales dropped by 3% annually to close 2023, its slowest decline in two years.
4. SFR INVESTMENT TRENDS
- According to latest data from Arbor Realty Trust/Chandan Economics, SFR/BTR construction starts reached a new record high in Q2 2023 as cap rates compress, accounting for 7.7% of all single-family starts.
- SFR cap rates fell to 6.1% during Q3 2023, the latest data available, as home prices climbed. Concurrently, SFR rents remained strong.
- SFR occupancy levels averaged 94.4% in Q3, dropping by 10 basis points from the previous quarter. Rent growth has continued to slow, dropping to 4.5% year-over-year through July, the latest data tracked in the report. It was the slowest annual rent growth tracked since April 2020, however, while rent growth has decelerated from its pandemic levels, it currently stands above its 2015-2019 average by a full percentage point.
- Investor purchases of single-family properties continued to decline in 2023, though at a slower pace than the year before, declining by -34.1% in Q2.
5. NON-RESIDENTIAL CONSTRUCTION MOMENTUM
- According to a recent analysis of Census Bureau data by the Associated Builders and Contractors (ABC), a national wave of non-residential construction spending should continue into 2024 despite a downtick in November.
- The analysis showed that non-residential construction spending fell by 0.1% in November due to a drop in public-sector activity, which dropped sharply during the month at a rate of -0.6% month-over-month. Meanwhile, private non-residential spending rose by 0.2% monthly.
- Spending is up by 18.1% over the past year, according to the ABC, while manufacturing-related construction spending continues to surge, according for roughly 45% of the increase in spending over the past 12 months.
6. INFLATION OUTLOOK
- Inflation is expected to continue to fall throughout 2024 driven by the unwinding of supply-chain driven price spikes and falling economic growth, according to a recent analysis by Morningstar.
- The report’s analysts forecast that durable goods will see the greatest drop in inflation or potential deflation as major supply constraints have faded and the global semiconductor market trends towards market surplus. Food and energy price pressures will also likely subside, as the market adjusts to the challenges brought on by the Russia-Ukraine War. Housing price pressures should also reduce as new supply comes online.
- The PCE price index has fallen from a peak of 7% annually in June of 2022 to 2.6% year-over-year through November 2023. Core PCE inflation, the FOMC’s preferred measure, has similarly declined but less steeply.
- The analysts expect average US prices to climb by 1.8% per year between 2024 and 2027, below the Fed’s 2.0% PCE target rate. However, if price pressures continue to exceed 2.0% as the Fed’s tightening cycle unwinds, officials may be ready to induce a recession in 2024 to achieve its goals.
7. CMBS DELINQUENCIES
- CMBS delinquencies fell seven basis points in December, according to recent data by Trepp. Moreover, December’s CMBS activity reverses several months of rising Office delinquencies, with the sector’s rate declining by 26 basis points to 5.82%.
- Annually, the overall CMBS delinquency rate up 147 basis points from the end of 2022 to 4.51% in December 2023, led by the Retail sector with a 6.47% rate. The delinquency rate for Office is a close second at 5.82%.
- Industrial and Lodging were the only sectors tracked that saw a monthly in delinquencies during December, each climbing by 19 bps to 0.57% and 5.40%, respectively. Nonetheless, Industrial delinquencies are negligible compared to the overall market.
8. RETAIL INVENTORIES
- Retail inventories, excluding autos, dropped by 0.8% month-over-month in November, its third consecutive monthly decline, in part reflecting the seasonality factor of relatively high sales activity during the holidays.
- Monthly inventory growth during 2023 reached a high of 3.8% month-over-month during February and as low as -1.1% month-over-month in October. The historical monthly average for retail inventory growth, which has been tracked since 1992, is 0.3%.
- Including autos, annual retail growth charted in at 5.1% during November, reflecting the outsized impact that vehicle sales have on retail inventories. Nonetheless, retail inventories including autos also ticked down on a month-over-month basis, falling -0.1% month-over-month.
9. WHOLESALE INVENTORIES
- US wholesale inventories fell by 0.2% month-over-month through November, its second straight monthly decline, according to Census Bureau data. Besides a flat reading in February and a slight uptick in September, monthly wholesale inventories fell consistently throughout 2023.
- Inventory declines follow a dop in non-durable goods, which dropped -9.6% in November following a 0.9% in October. Meanwhile, inventories of durable goods rose in November by 1.2% following a flat October.
- Inventories fell 3.1% year-over-year through November, with December’s holiday activity likely adding downward pressure to wholesale levels.
10. REDBOOK INDEX
- The Redbook Index, a weekly sales-weighted index of year-over-year same-store sales growth of large US retailers, finished 2023 with a 5.6% increase over the same week in 2022, according to Redbook Research, Inc.
- Between 2005, when the index was created, and the end of 2023, the US Redbook Index has averaged 3.58%. The index’s all-time low was -12.6% reached during the initial pandemic shutdown in May 2020, while its all-time high of 21.9% was reached in November 2021.
- After reaching its November 2021 peak, the US Redbook spent all of 2022 in decline before rebounding in 2023. Index growth is unlikely to return to record growth seen during the pandemic’s economic rebound, but merchandise sales have maintained a healthy level in the face of increased economic uncertainty over the past year
SUMMARY OF SOURCES
- (1) https://www.bls.gov/news.release/empsit.nr0.htm
- (2) https://www.federalreserve.gov/monetarypolicy/fomcminutes20231213.htm\
- (3) https://www.redfin.com/news/housing-market-update-monthly-payments-drop/
- (4) https://arbor.com/research/reports/single-family-rental-investment-trends-report-q4-2023/?utm_content=2023_q4&utm_medium=blog&utm_source=chatter&utm_campaign=chandan_sfr_quarterly_report&utm_term=NA&UTMsource=chatter&rdnaLabel=chandan_sfr_quarterly_report
- (5) https://www.globest.com/2024/01/04/nonresidential-construction-momentum-expected-to-continue/
- (6) https://www.morningstar.com/economy/why-we-expect-inflation-fall-2024
- (7) https://www.trepp.com/trepptalk/cmbs-delinquency-rate-falls-slightly-december-2023-office-rate-posts-rare-dip
- (8) https://www.census.gov/economic-indicators/#adv_mrts
- (9) https://www.census.gov/economic-indicators/#adv_mrts
- (10) https://www.redbookresearch.com/8702.html
Banks hold over half of $6 trillion in commercial real estate loans, with symptoms of stress having appeared, according to the 2023 annual report.
Multiple financial dangers for the United States were identified by the Financial Stability Oversight Council, a remnant of the Dodd-Frank Act that comprises a wide range of federal banking regulators and others, in its 2023 annual report. Commercial real estate comes first on the list.
$6 trillion in loans at the top of the CRE segment as of Q2 2023, half of which are on bank balance sheets because they aren’t sold to government agencies like residential mortgages are. Furthermore, nearly half of all U.S. banks offer the greatest amount of loans in the CRE sector.
No one who has been following the market should be surprised by the concentration, especially considering that “the CRE market faced a rise in vacancy rates and declines in value for some property types, elevated interest rates, heightened CRE loan maturities, inflation in property operating costs, and an increase in CRE loan delinquencies.”
The agency expresses a concern that many in the CRE have voiced. According to the research, high interest rates raise refinancing costs for borrowers and can result in declining property values across CRE sectors. The borrower might not be eligible to refinance the loan at maturity without an additional equity infusion if the property value has significantly declined since the time of financing. As a result, the lender may suffer losses if the loan needs to be restructured or goes into default. Losses from a portfolio of CRE loans may seep into the larger financial system as they accrue.
This may lead banks to liquidate loans and real estate, further depressing values, generating a vicious cycle, and limiting credit availability. Loan distress is already evident; in the second quarter of 2022, the bank default rate increased by 0.74 percent. Delinquencies for CMBS are also higher.
Another worry is that relationships between banks, insurance providers, real estate investment trusts, and private lenders could allow bank stress to spread.
“Supervisors, financial institutions, and investors continue to closely monitor CRE exposures and concentrations and to track market conditions,” according to several recommendations made by the FSOC.
“Resilience to potential stress, ensuring adequate credit loss allowances, assessing CRE underwriting standards, and reviewing contingency planning for a possibly protracted period of rising loan delinquencies” are some of the recommendations for continuous assessment of loan portfolios.
The SVN Vanguard team knows investors need an experienced commercial property management company by their side. Contact us for multifamily properties for sale.
Delinquency rates for lenders with the strictest underwriting guidelines are somewhat higher.
The most recent Commercial Delinquency Report from the Mortgage Bankers Association shows that, for the third consecutive month, there was an unanticipated increase in commercial mortgage delinquencies in the third quarter of 2023.
In prepared remarks, Jamie Woodwell, MBA’s Head of Commercial Real Estate Research, stated that rising interest rates, shifts in certain aspects of the real estate market, and uncertainty around property valuations were the main causes of an increase in delinquency rates across all major capital sources.
According to Woodwell, “CRE market activity remains muted, further complicating the situation.”
Mortgage performance varies significantly depending on the type of property, according to data from the MBA survey that was made public earlier this quarter.
According to Woodwell, a wide range of factors, including deal vintage, term, and market conditions, also influence which loans are under pressure. These distinctions are probably going to stay significant in the upcoming year.
Delinquency rates for banks and thrifts (90 days or more past due or non-accrual) based on the unpaid principal balance (UPB) of loans are 0.85% in Q3, up 0.18 percentage points from Q2 2023.
With 60 days or more past due, the life company portfolios had rates of 0.32 percent, up 0.18 percentage points from Q2 2023.
The rate for Fannie Mae loans (60 days or more past due) was 0.54 percent, up 0.17 percentage points from Q2 2023.
Loans from Freddie Mac that were 60 days or more past due had a 0.24 percent default rate, up 0.03 percentage points from Q2 2023.
The percentage of CMBS loans in REO or 30 days or more past due was 4.26 percent, up 0.44 percentage points from Q2 2023.
According to Selina I. Parelskin, CEO and founder of Beacon Default Management, the research presents a dire image of the status of the CRE capital markets, but the situation may well be considerably worse. She informs GlobeSt.com that while these figures include loans for building and development, private lenders and debt funds are not included in this list.
“A few of these have lent many tens of billions of dollars on high-leverage multifamily syndicated loans, where the sponsor has a very small amount at risk compared to their investors and lenders,” the spokesperson stated. “Some of these use their own bank lines.”
The debt fund will not be paid back in full, the investors and borrowers have lost all of their equity, and the underlying warehouse or credit facility will suffer a loss. A large number of these funds are expected to experience loan losses.
According to Parelskin, almost 25% of the loans held by these funds are either matured or in default.
According to her, the majority of debt funds ignored inflation worries and believed that interest rates and cap rates would remain at historically low levels. Up to 80% loan to cost and the equivalent of 3.25% cap rates on in-place income were required at the time of going into underwriting.
According to Parelskin, a lot of bankers are working hard to adjust their problematic debt.
However, based on our discussions, we anticipate a notable increase in commercial mortgage delinquency rates by the end of Q1 2024, as the spokesperson stated.
Vice President of MetroGroup Realty Finance, Ivan Kustic, tells GlobeSt.com that the MBA data supports the originators and suppliers of these mortgages that his company is experiencing.
Banks and thrifts are generally on the lower end of the recourse spectrum, while Fannie and Freddie are on the lower end due to their reputation as highly performing multifamily assets, Kustic stated.
According to him, life insurance businesses that practice conservative underwriting and have lower loan-to-value ratios often have fewer delinquencies.
According to Kustic, the CMBS has a rate of 4.26%, which is significantly higher than the other four lending groupings. It also has more aggressive loan values and more liberal underwriting.
Thus, he explained, the lenders with the most aggressive underwriting standards will see slightly higher delinquencies than the other four lending groups when we see stress in the real estate market.
The SVN Vanguard team knows investors need an experienced commercial property management company by their side. Contact us for multifamily properties for sale.
